HTMLのcanvas要素の基礎, アニメーションからチャートの描写まで
HTMLのcanvas要素を利用して何か図形やチャートを描写したことはありますか?利用した経験がないという人が大半ではないでしょうか。しかし自分でcanvas要素を使った経験がないと思っている人でも実はFigmaなどのデザインツールやmiroなどのオンラインホワイトボードなどのアプリケーションをブラウザ上で利用している場合にはcanvas要素を利用しています。
本文書では四角や円の基本的な図形の描写方法を確認した後にアニメーションの設定方法を確認し、最後にBar Chart(棒グラフ)をライブラリを利用せずスクラッチからJavaScriptとcanvas要素のみを利用して作成することでcanvas要素の理解を深めていきます。
本文書を読み終えるとアニメーションも設定されたBar Chartで自作することができるようになります。
canvas要素の基礎
canvas要素はcanvasタグを利用しますがcanvasタグを設定しただけでは描写する領域を確保するだけで図形などのグラフィックスをcanvas上に表示させるためにはJavaScriptを利用する必要があります。
canvas要素の確認
任意の場所にindex.htmlファイルを作成してcanvasタグを追加します。
<!DOCTYPE html>
<html lang="ja">
  <head>
    <meta charset="UTF-8" />
    <meta name="viewport" content="width=device-width, initial-scale=1.0" />
    <title>Document</title>
  </head>
  <body>
    <canvas id="canvas"></canvas>
  </body>
</html>
canvasタグを追加後にブラウザで確認しても何も表示されません。canvas要素上に図形を描写するためにJavaScriptを利用する必要があります。JavaScrtiptのdocument.getElementByIdでcanvasタグに設定したid属性の”canvas”を指定してcanvas要素を取得した後にdrawing contextを取得するためにgetContextメソッドを実行します。getContextメソッドの引数には2次元を意味する”2d”を設定します。
<!DOCTYPE html>
<html lang="ja">
  <head>
    <meta charset="UTF-8" />
    <meta name="viewport" content="width=device-width, initial-scale=1.0" />
    <title>Document</title>
  </head>
  <body>
    <canvas id="canvas"></canvas>
  </body>
  <script>
    const canvas = document.getElementById('canvas');
    const ctx = canvas.getContext('2d');
    console.log(ctx)
  </script>
</html>
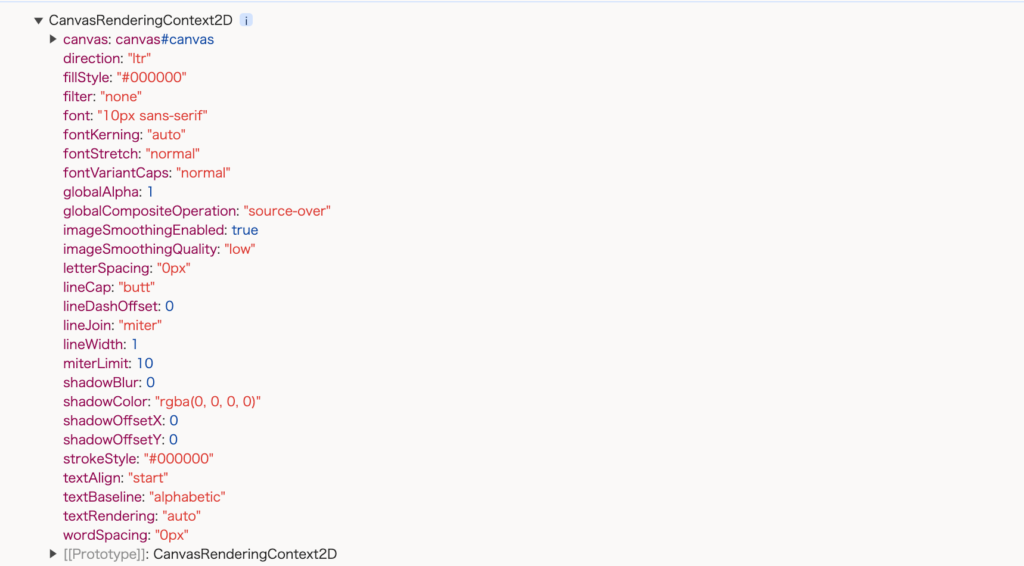
getContextメソッドを実行しても先ほどと変わらずブラウザ上には何も表示されませんがブラウザのでばろっパーツールのコンソールにはgetContextメソッドから戻されるCanvaswRenderingContext2Dオブジェクトの情報が表示されます。CanvaswRenderingContext2DオブジェクトにはfillStyleやfontなどさまざまなプロパティを持っていることがわかります。これらの値は後ほど動作確認を行うなかで値の変更を行います。
canvasの描写領域の理解
canvasタグは図形の描写領域を確保するだけなのでgetContextで戻されるdrawing Context(ctx)のメソッドを利用することで図形を描写することができまs。
設定したcanvas上に四角の図形を描写したい場合にはfillRectメソッドを利用します。
const canvas = document.getElementById('canvas');
const ctx = canvas.getContext('2d');
ctx.fillRect(50, 100, 100, 150);
fillRectメソッドの引数はx, y, width, heightを持ちそれぞれの値は以下の意味を持ちます。canvas要素の原点である(0,0)は左上となります。
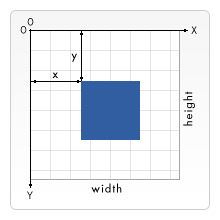
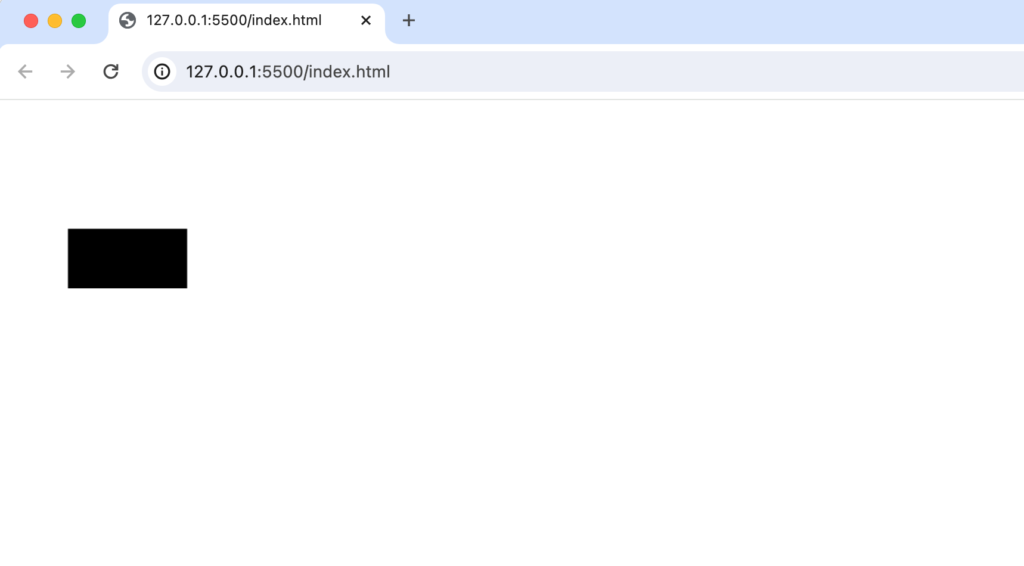
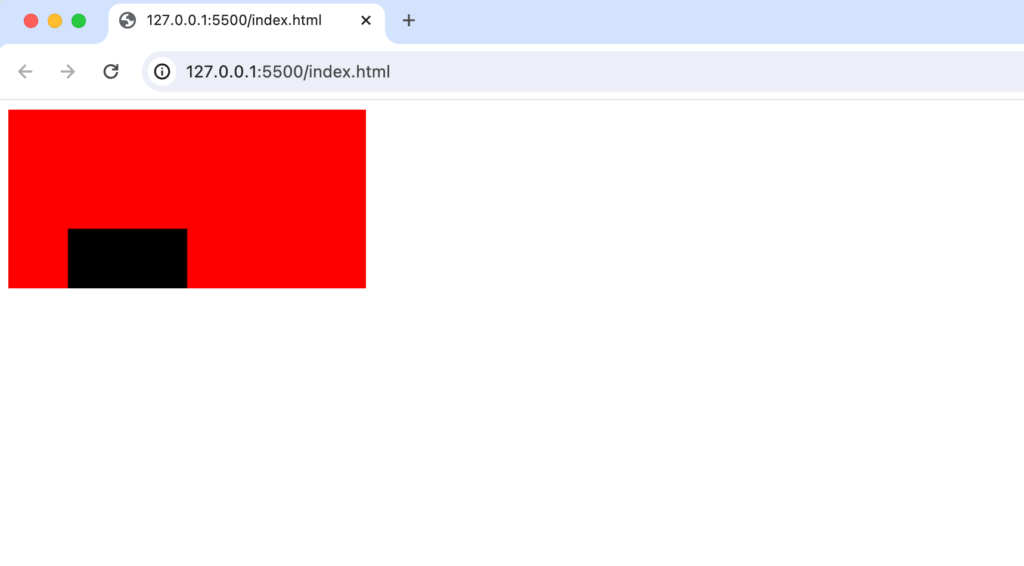
ブラウザで確認するとfillRectメソッドの引数でxは50, yは100、widthを100, heightを150に設定をしているので縦長の四角が描写されるはずですが横長の四角として描写されています。
引数の設定に間違いがあるわけではなくcanvasの描写領域を確認することでなぜ横長になっているかが確認できます。canvasの描写範囲が描かれていないので範囲がわかるようにstyleのbackgroudColorを利用して色を設定します。
const canvas = document.getElementById('canvas');
const ctx = canvas.getContext('2d');

canvas.style.backgroundColor = 'red';

ctx.fillRect(50, 100, 100, 150);
backgroundColorに赤を設定することでcanvasの描写範囲が赤色といなります。fillRectで縦長の四角を設定したにも関わらず横長として表示されたのは四角の図形の一部がcanvasの描写範囲を超えているためです。
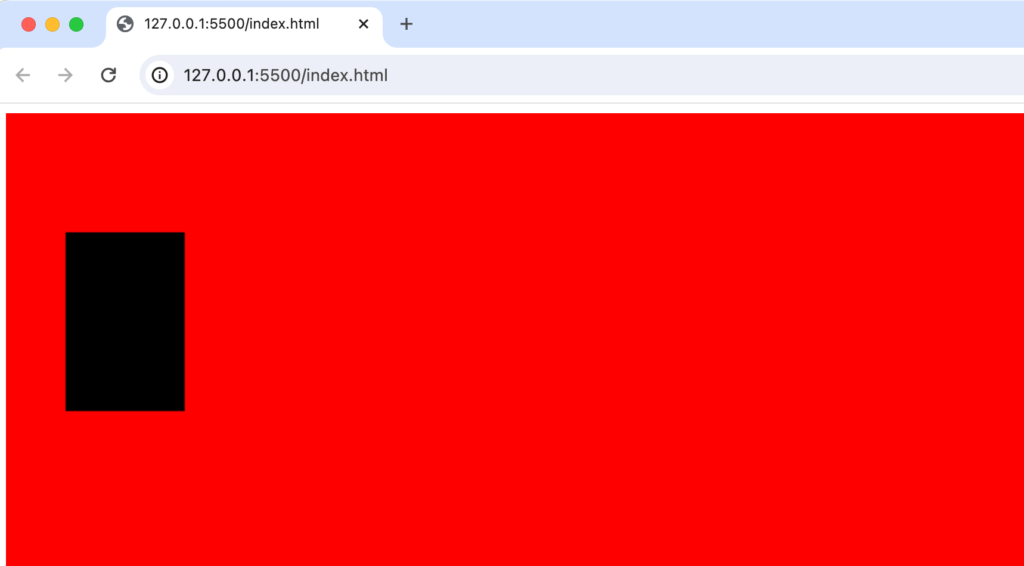
canvasの描写範囲のデフォルトサイズは300pxと150pxに設定されています。canvasのサイズの変更は ctx変数ではなくcanvasタグのwidth, heightプロパティで行うことができ、ブラウザ全体をcanvasの描写範囲とするためにwindow.innerHeightとwindow.innerWidthを設定します。window.innerHeightとwindow.innerWidthはブラウザウィンドウの表示領域の高さと幅です。
const canvas = document.getElementById('canvas');
const ctx = canvas.getContext('2d');

canvas.style.backgroundColor = 'red';

canvas.height = window.innerHeight;
canvas.width = window.innerWidth;

ctx.fillRect(50, 100, 100, 150);
canvasの描写領域のサイズをブラウザのウィンドウ一杯にすることでfillRectで設定した四角は設定した通り縦長の四角として表示されます。
canvasのwidthのheightの設定はcanvasタグにそのまま設定することもできます。
<!DOCTYPE html>
<html lang="ja">
  <head>
    <meta charset="UTF-8" />
    <meta name="viewport" content="width=device-width, initial-scale=1.0" />
    <title>Canvas</title>
  </head>
  <body>
    <canvas id="canvas" width="600" height="400"></canvas>
  </body>
  <script>
    const canvas = document.getElementById('canvas');
    const ctx = canvas.getContext('2d');
    canvas.style.backgroundColor = 'red';
    ctx.fillRect(50, 100, 100, 150);
  </script>
</html>
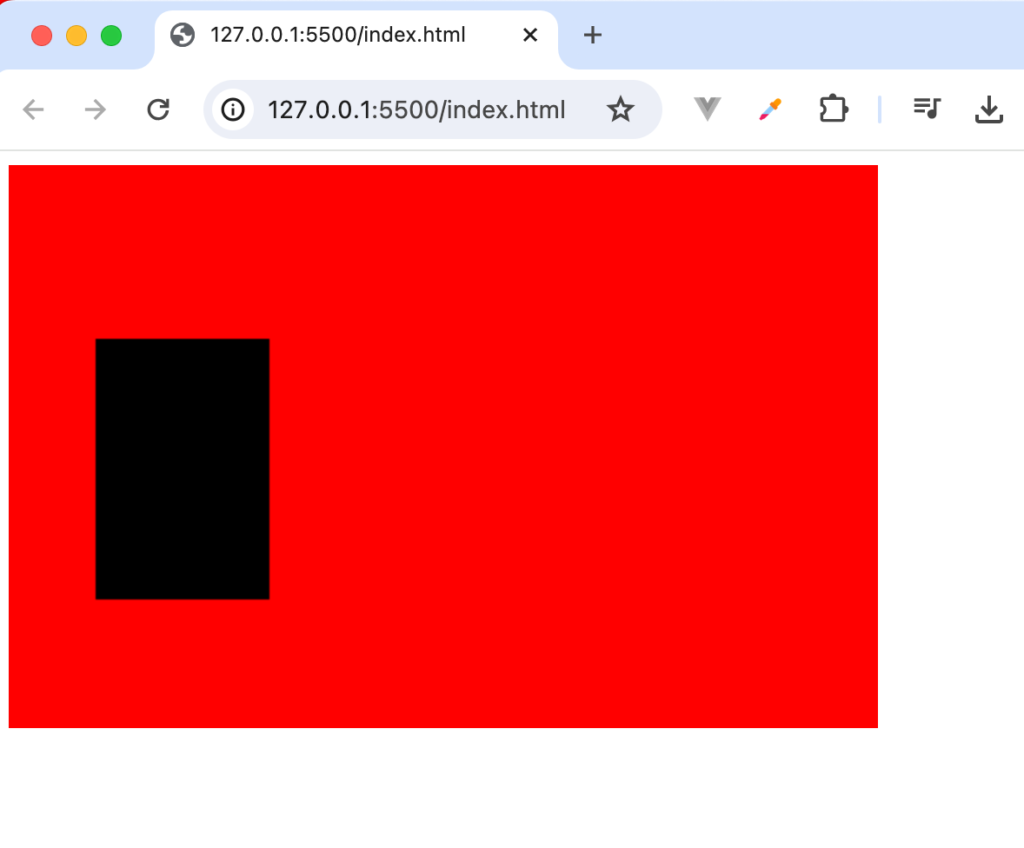
ブラウザのサイズを最初に表示させた状態から大きくすると拡大した部分の背景は白となります。
ブラウザのサイズが変更された場合にcanvasが再描写されるようにwindowsのresizeイベントを設定します。ctx.fillRectをresizeイベントのcallback関数の処理に入れることでcanvasがサイズ変更により再描写されても四角のオブジェクトをブラウザ上に表示させ続けることができます。resizeイベントのcallback関数の中にfillRectメソッドを設定しない場合は四角は描写されません。
const canvas = document.getElementById('canvas');
const ctx = canvas.getContext('2d');

canvas.style.backgroundColor = 'red';

canvas.height = window.innerHeight;
canvas.width = window.innerWidth;

window.addEventListener('resize', () => {
    canvas.height = window.innerHeight;
    canvas.width = window.innerWidth;
    ctx.fillRect(50, 100, 100, 150);
});
ctx.fillRect(50, 100, 100, 150);
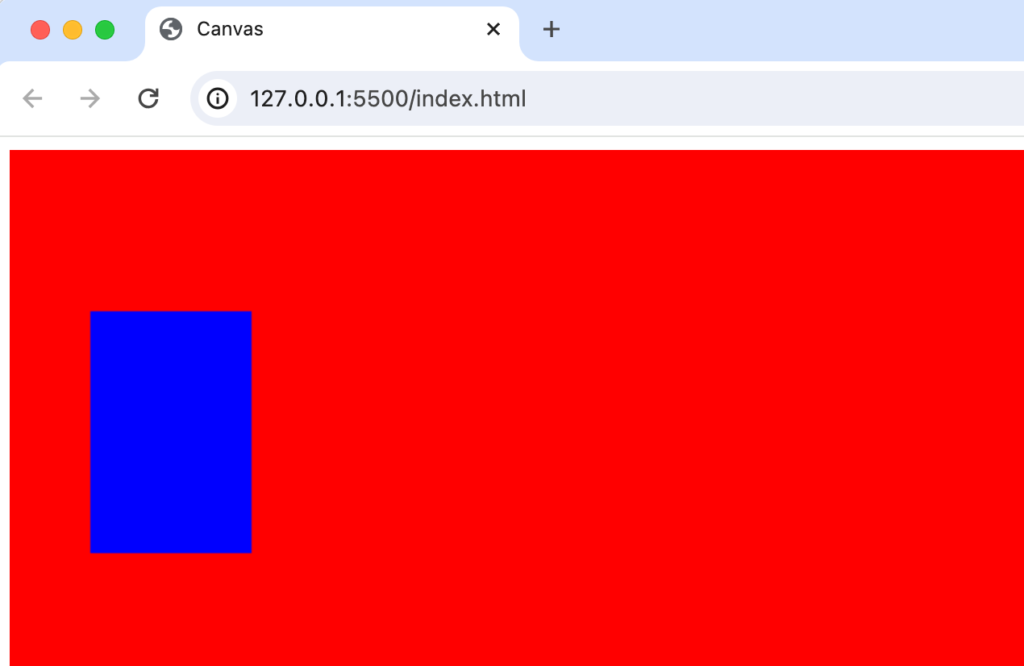
四角の色を黒から青に変更したい場合にはfillStyleプロパティを利用することができます。fillStyleプロパティはfillRectメソッドの前に設定を行う必要があります。後に設定した場合には色はデフォルトの黒のままです。
ctx.fillStyle = 'blue';
ctx.fillRect(50, 100, 100, 150);
円の描写
四角の場合はfillRectでしたが、円を表示する場合はarcメソッドを利用します。arcは弧を表してarcメソッドの引数はarc(x, y, radius, startAngle, endAngle, counterclockwise)となります、counterclockwiseはboolean値を取り、時計回りか反時計回りに弧を描くかを指定できます。省略すると時計回りとなります。
const canvas = document.getElementById('canvas');
const ctx = canvas.getContext('2d');
canvas.height = window.innerHeight;
canvas.width = window.innerWidth;
window.addEventListener('resize', () => {
canvas.height = window.innerHeight;
canvas.width = window.innerWidth;
});
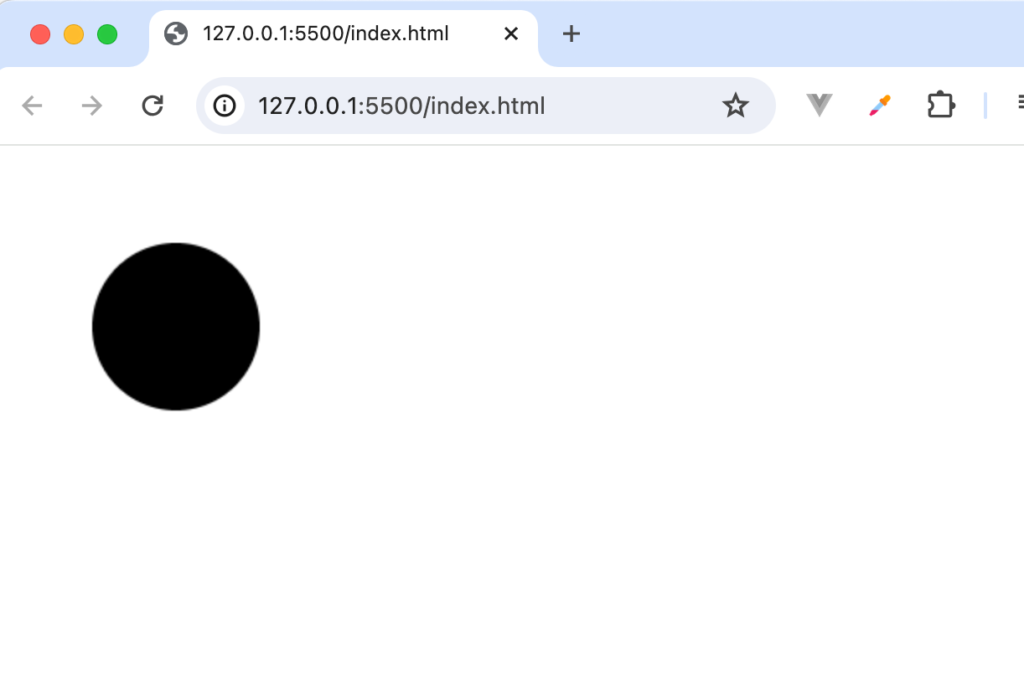
ctx.arc(100, 100, 50, 0, Math.PI * 2);
ctx.fill();
ブラウザで確認すると円が表示されます。ctx.fillメソッドを設定しない場合には円は表示されません。
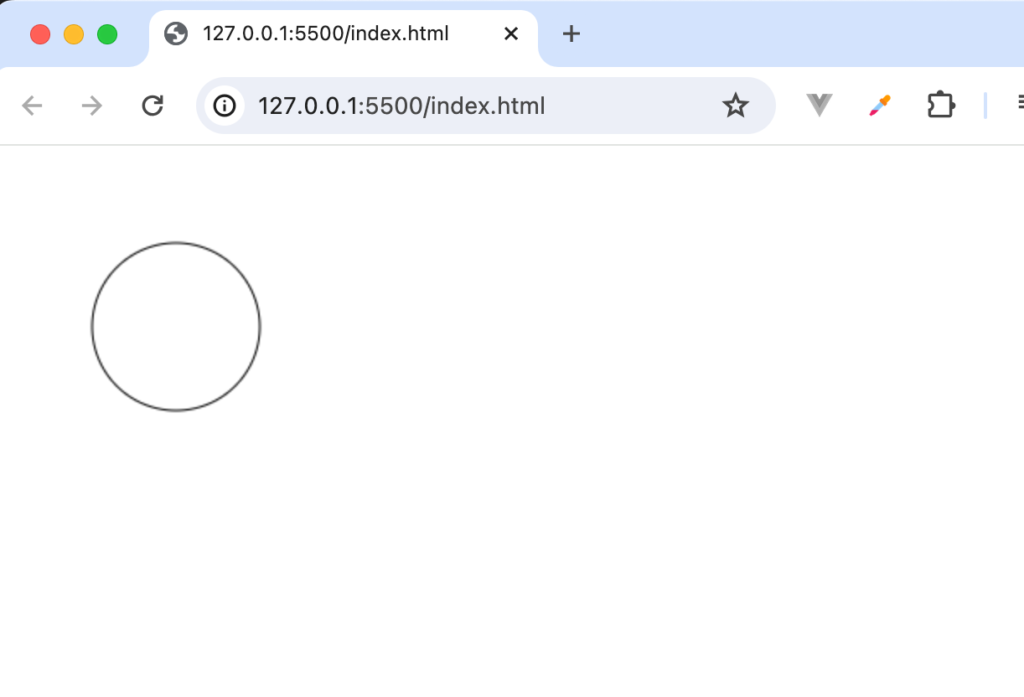
fillメソッドからstrokeメソッドに変更すると線で円を描写することができます。
ctx.arc(100, 100, 50, 0, Math.PI * 2);
ctx.stroke();
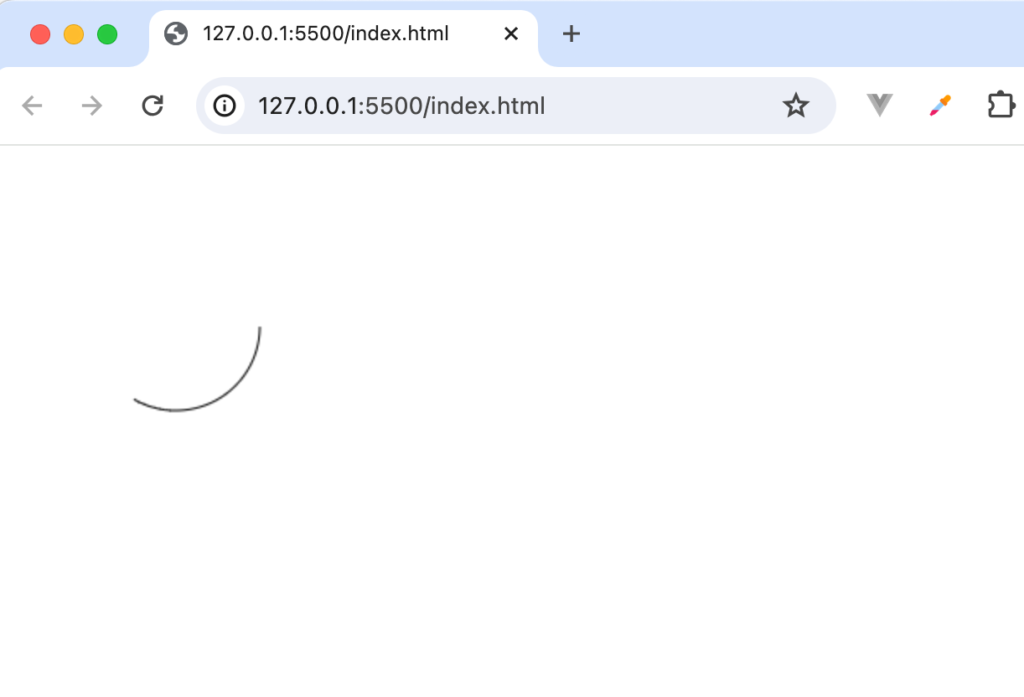
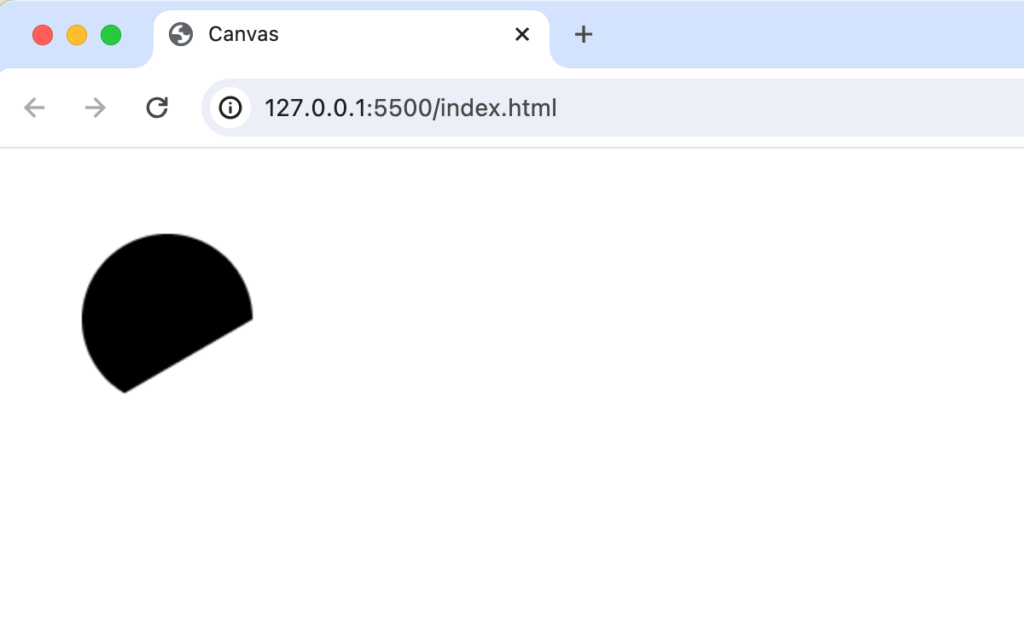
arcという名前ですが円で表示されるのはendAngleの引数をMath.PI * 2に設定しているためです。弧として表示させるためにMath.PI*2の値を3で割ります。
ctx.arc(100, 100, 50, 0, (Math.PI * 2) / 3);
ctx.stroke();
円ではなく弧として表示されます。
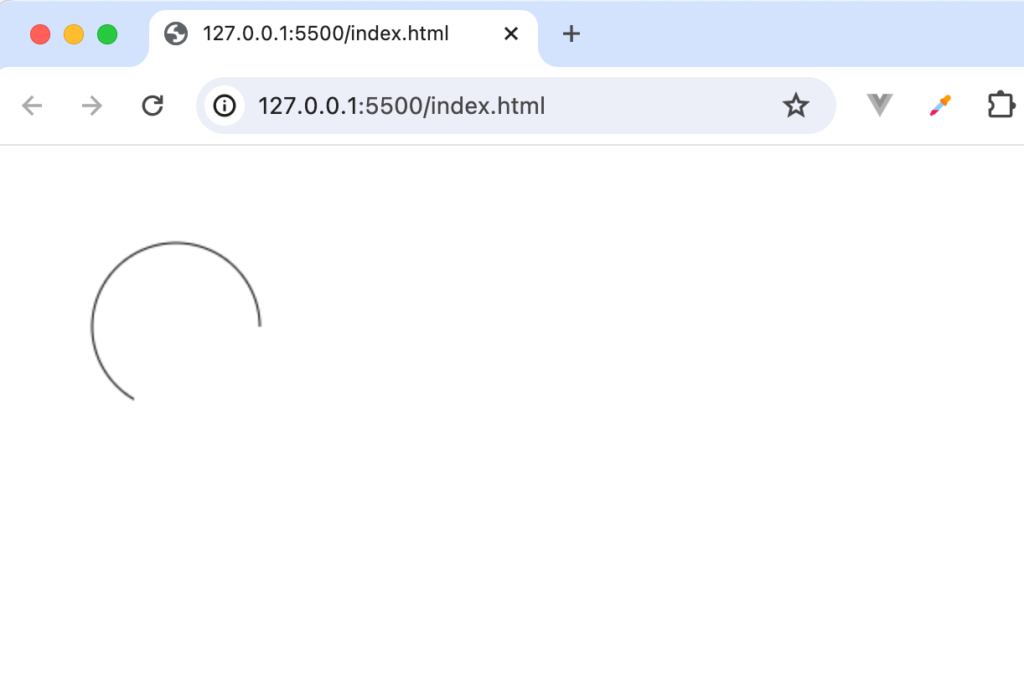
さらに省略していたcounterclockwiseの値にデフォルトのfalseでなくtrueを設定します。
ctx.arc(100, 100, 50, 0, (Math.PI * 2) / 3, true);
ctx.stroke();
先ほどとは異なり反対周りで弧が描かれていることがわかります。
strokeメソッドからfillメソッドに変更すると下記のように表示されます。
直線の描写
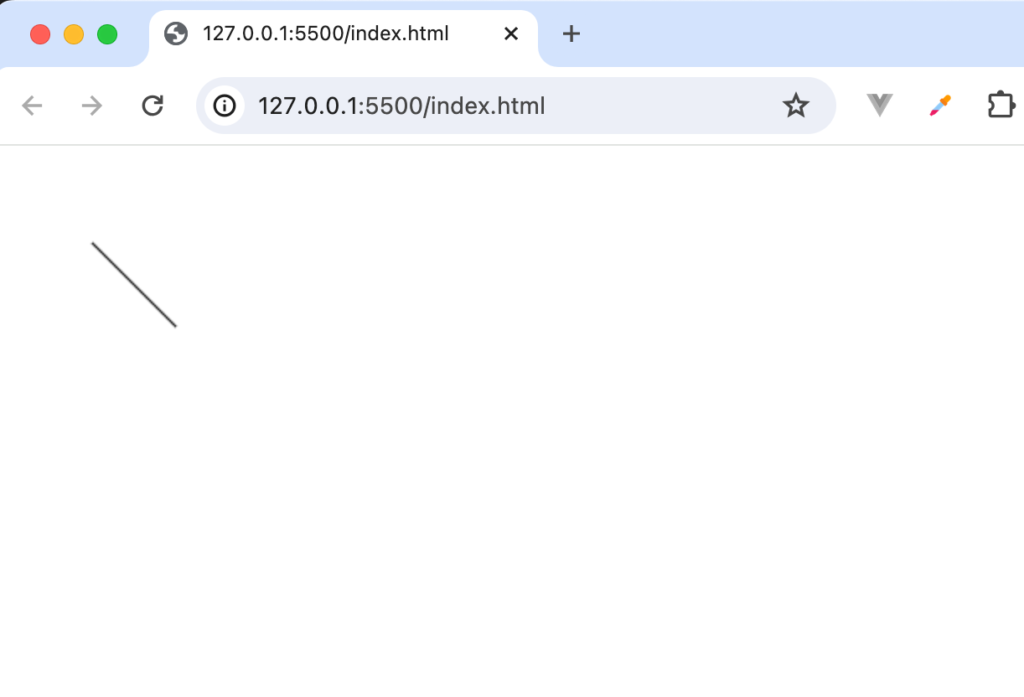
canvas上に直線を描写したい場合の設定方法を確認します。x, yが50, 50の位置(始点)からx,yが100,100の位置(終点)に直線を引きたい場合にはmoveToで始点の位置を設定して、lineToで終点の位置を設定します。
const canvas = document.getElementById('canvas');
const ctx = canvas.getContext('2d');

canvas.height = window.innerHeight;
canvas.width = window.innerWidth;

window.addEventListener('resize', () => {
    canvas.height = window.innerHeight;
    canvas.width = window.innerWidth;
});

ctx.moveTo(50, 50);
ctx.lineTo(100, 100);
ctx.stroke();
ブラウザ上では下記のように表示されます。
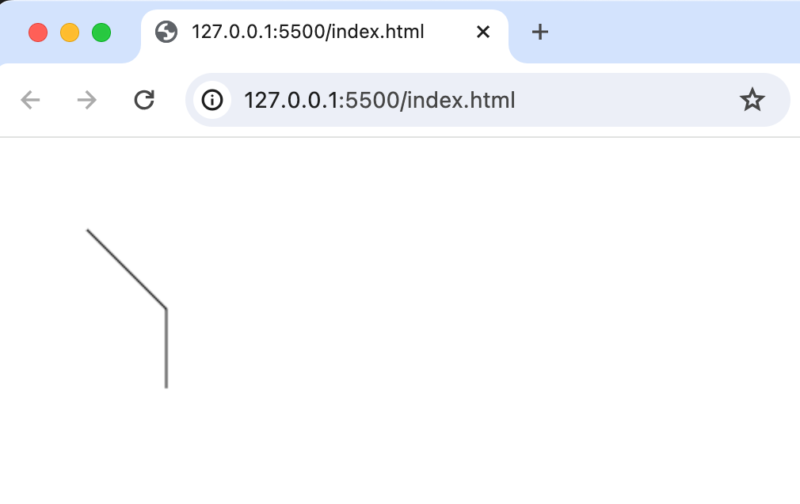
この線からさらに別の線を引きたい場合にはそのままlineToメソッドを続けて記述します。
ctx.moveTo(50, 50);
ctx.lineTo(100, 100);
ctx.lineTo(100, 150);
ctx.stroke();
1つ目のlineToの終点が100,100なので100,100の点を起点に次の線は100,150が終点になるように線が表示されます。
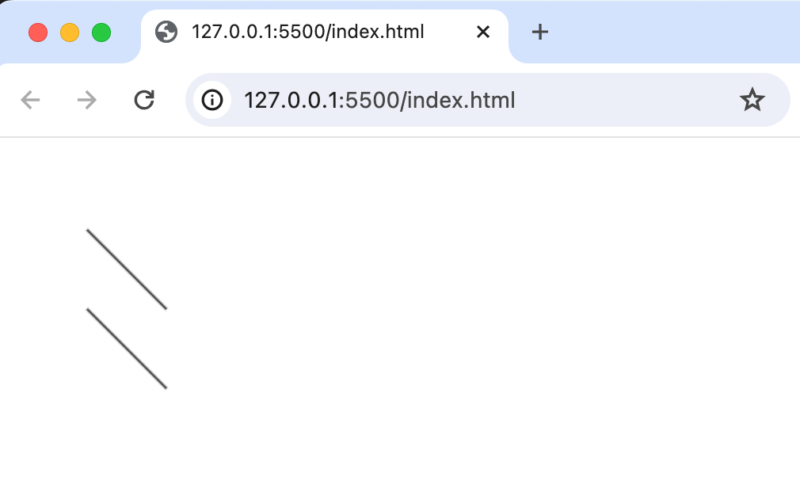
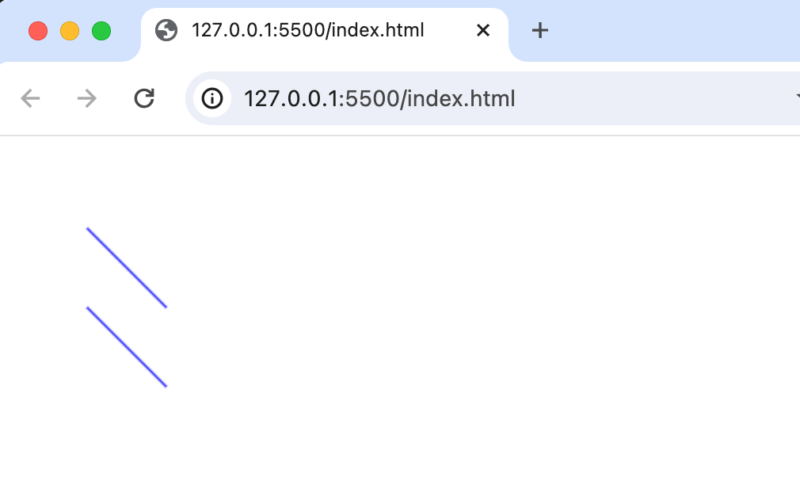
1つ目の線と平行の線を引きたい場合にはmoveToで始点の位置を指定してそこからlineToで指定した終点に向けて線を引きます。
ctx.moveTo(50, 50);
ctx.lineTo(100, 100);

ctx.moveTo(50, 100);
ctx.lineTo(100, 150);
ctx.stroke();
ブラウザで確認すると先ほどとは異なり始点、終点の異なり2つの平行の線を描写することができます。
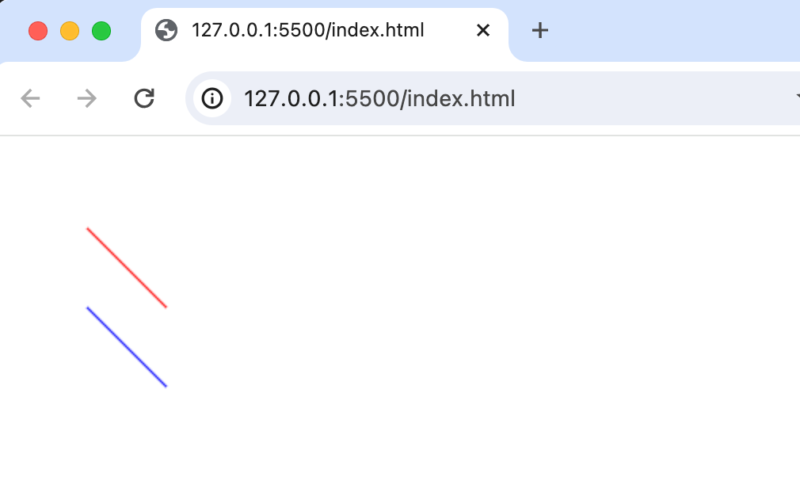
色の設定
並行の直線に対して赤と青の別々の色を設定してみましょう。線に色を設定する場合にはstrokeStyleプロパティを利用します。
ctx.moveTo(50, 50);
ctx.lineTo(100, 100);
ctx.strokeStyle = 'red';

ctx.moveTo(50, 100);
ctx.lineTo(100, 150);
ctx.strokeStyle = 'blue';
ctx.stroke();
ブラウザで確認するとred, blueと2回設定しているにも関わらずどちらの線も2回目に設定した青になっています。
別々の設定を反映させるためには図形を作成する際にbeginPathメソッドを実行します。beginPathメソッドを実行することで前の設定がクリアされます。クリアされるのは色だけではなくctx.strokeもクリアされるのでこちらも忘れずに設定を行います。
ctx.beginPath();
ctx.moveTo(50, 50);
ctx.lineTo(100, 100);
ctx.strokeStyle = 'red';
ctx.stroke();

ctx.beginPath();
ctx.moveTo(50, 100);
ctx.lineTo(100, 150);
ctx.strokeStyle = 'blue';
ctx.stroke();
beginPathメソッドとctx.strokeメソッドをそれぞれの直線に設定することで異なる色の線を設定することができます。
三角の描写
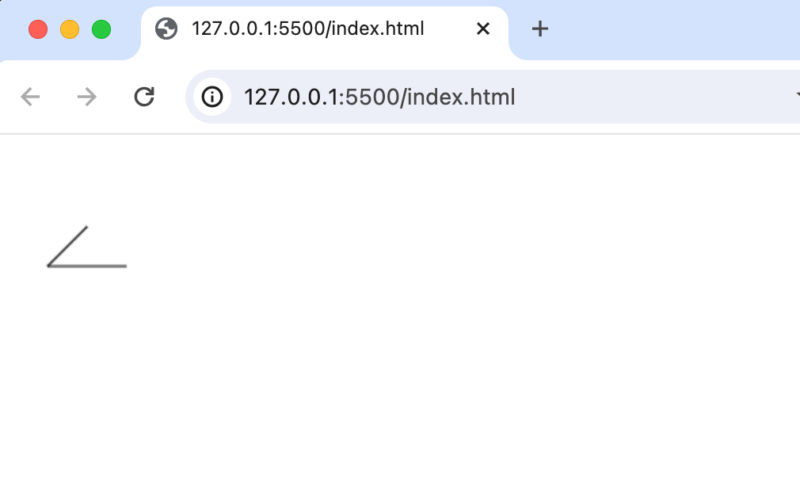
四角の図形の描写にはfillRectメソッドのみで簡単に描写することができましたが三角の場合は直線を利用して描写することができます。
ctx.beginPath();
ctx.moveTo(50, 50);
ctx.lineTo(25, 75);
ctx.lineTo(75, 75);
ctx.stroke();
上記の設定ではブラウザで確認すると2本の線が表示されます。
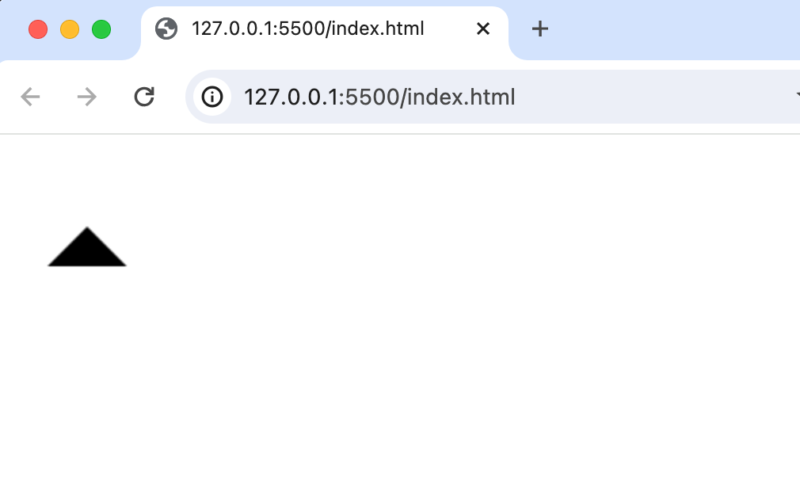
ctx.strokeメソッドからctx.fillメソッドに変更すると三角として描写されます。
ctx.beginPath();
ctx.moveTo(50, 50);
ctx.lineTo(25, 75);
ctx.lineTo(75, 75);
ctx.fill();
さらにlineToを追加し、引数に三角の始点である50,50を指定すれば直線だけで三角を描写することができます。
ctx.beginPath();
ctx.moveTo(50, 50);
ctx.lineTo(25, 75);
ctx.lineTo(75, 75);
ctx.lineTo(50, 50);
ctx.stroke();
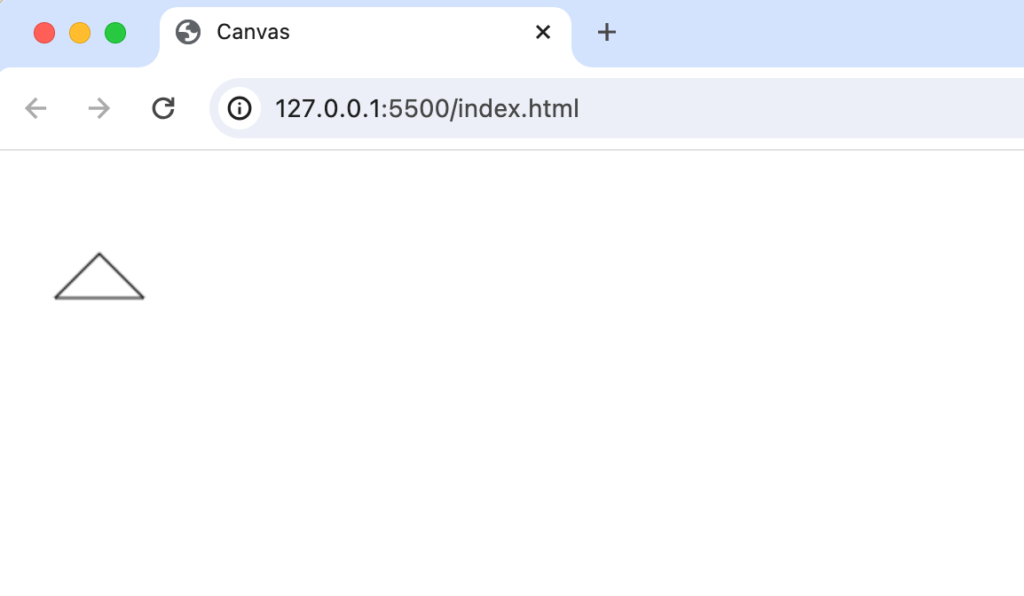
線を利用することで三角以外にもさまざまな図形を描写することができます。
イベントによる図形の描写
ここまで設定では事前に指定した場所に指定した図形をcanvas上に描写するものでした。ここではイベントを利用してcanvas上のクリックした場所に円を描写します。つまりユーザとのインタラクティブを通してcanvas上に図形を描写させます。
クリックによる円の描写
canvas要素にclickイベントを設定してクリックした位置の情報を取得してコンソールに表示させます。
<!DOCTYPE html>
<html lang="ja">
  <head>
    <meta charset="UTF-8" />
    <meta name="viewport" content="width=device-width, initial-scale=1.0" />
    <title>Canvas</title>
  </head>
  <body>
    <canvas id="canvas" width="600" height="400"></canvas>
  </body>
  <script>
    const canvas = document.getElementById('canvas');
    const ctx = canvas.getContext('2d');

    canvas.height = window.innerHeight;
    canvas.width = window.innerWidth;

    canvas.addEventListener('click', (e) => {
      console.log(e.clientX, e.clientY);
    });
  </script>
</html>
設定後、ブラウザのデベロッパーツールのコンソールを確認するとブラウザ上でクリックを行う度にクリックした位置の値が表示されます。
円の描写方法は確認済みなのでdrawCircle関数を追加します。drawCircle関数の引数にはx, y, radiusを取ります。
const drawCircle = (x, y, radius) => {
    ctx.beginPath();
    ctx.arc(x, y, radius, Math.PI * 2, false);
    ctx.fill();
};
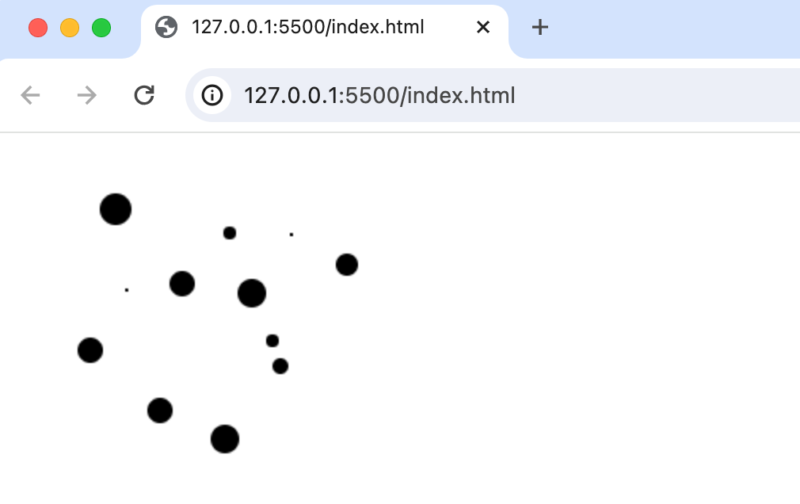
クリックする度に異なるサイズの円を描写するために半径のradiusは1から10のランダムな値が取れるようにしています。
const canvas = document.getElementById('canvas');
const ctx = canvas.getContext('2d');

canvas.height = window.innerHeight;
canvas.width = window.innerWidth;

const drawCircle = (x, y, radius) => {
    ctx.beginPath();
    ctx.arc(x, y, radius, Math.PI * 2, false);
    ctx.fill();
};

canvas.addEventListener('click', (e) => {
    const radius = Math.floor(Math.random() * 10) + 1;
    drawCircle(e.clientX, e.clientY, radius);
});
動作確認を行うとブラウザ上のcanvasの描写領域をクリックする度に異なる大きさの円が表示されます。
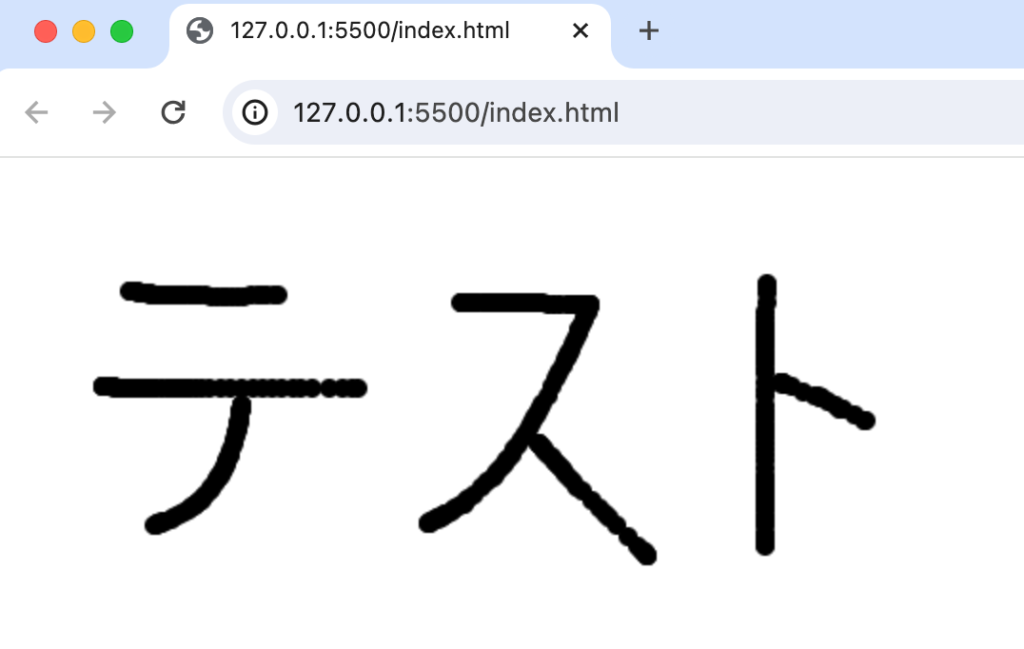
円を利用した文字の描写
円とmouseイベント(mouseup, mousedown, mousemove)を組み合わせることでcanvas上に文字を描写することもできます。

painting変数を定義してpaintingがtrueの場合のみmousemoveイベントで円を描きます。painting変数の値の切り替えはmouseup, mousedownイベントを利用して行っています。
const canvas = document.getElementById('canvas');
const ctx = canvas.getContext('2d');

canvas.height = window.innerHeight;
canvas.width = window.innerWidth;
let painting = false;

canvas.addEventListener('mousedown', () => {
    painting = true;
});

canvas.addEventListener('mouseup', () => {
    painting = false;
});

canvas.addEventListener('mousemove', (e) => {
    const radius = 5;
    if (painting) drawCircle(e.clientX, e.clientY, radius);
});

const drawCircle = (x, y, radius) => {
    ctx.beginPath();
    ctx.arc(x, y, radius, Math.PI * 2, false);
    ctx.fill();
};
マウスのクリックして、”ゆっくり”と動かすとmousemoveイベントが発火して以下のように円を利用して文字を描写できます。マウスを早く動かすと円と円の間が広く空きます。
マウスを追尾する円の描写
ここまでの設定ではマウスを動かすとmousemoveイベントにより次々円が描写されていました。複数の円を描写するのではなくマウスのポインティングを追いかける円を1つ描写されるように設定します。その場合には前の描写した図形をcanvas上から削除する必要があります。
canvas.addEventListener('mousemove', (e) => {
    ctx.clearRect(0, 0, canvas.width, canvas.height);
    const radius = 5;
    drawCircle(e.clientX, e.clientY, radius);
});

const drawCircle = (x, y, radius) => {
    ctx.beginPath();
    ctx.arc(x, y, radius, Math.PI * 2, false);
    ctx.fill();
};
ctx.clearRect(0, 0, canvas.width, canvas.height)を追加することでcanvasに描写されている図形を一括でクリアします。毎回mousemoveイベントが発火時にcanvas上に描写した図形がクリアされるので1つの円のみ表示されることになります。
requestAnimationFrameの利用
requestAnimationFrameは連続的なアニメーションを設定したい場合に利用することができる関数で先ほどmousemoveイベントを利用して実装していたマウスのポインティングを追いかける円をrequestAnimationFrameを利用して設定していきます。
const animate = () => {
    ctx.clearRect(0, 0, canvas.width, canvas.height);
    ctx.arc(x, y, radius, Math.PI * 2, false);
    requestAnimationFrame(animate);
};
animate();
animate関数を実行すると内部に記述したrequestAnimationFrame(animate)を実行することで引数に指定したanimate関数が実行されます。requestAnimationFrame(animate)を利用することで繰り返しanimate関数が実行され続けることになります。animate関数の中ではCanvas上の描写をクリアして再度円を描写しています。
ctx.arcの引数であるx,yの位置の情報をイベントから直接addEventListenerの中で直接指定していましたが新たにcircleという変数にオブジェクトとして保存します。animate関数を一度実行するとrequestAnimationFrame(animate)により実行され続けるのでcanvas上でマウスを動かすとクリックしているかどうかに関わらずマウスに合わせて円が動きます。
<!DOCTYPE html>
<html>
  <head>
    <meta charset="UTF-8" />
    <meta name="viewport" content="width=device-width, initial-scale=1.0" />
  </head>
  <body>
    <canvas id="canvas"></canvas>
  </body>
  <script>
    const canvas = document.getElementById('canvas');
    const ctx = canvas.getContext('2d');

    canvas.height = window.innerHeight;
    canvas.width = window.innerWidth;

    const circle = {
      x: undefined,
      y: undefined,
      radius: 5,
    };

    canvas.addEventListener('mousemove', (e) => {
      circle.x = e.clientX;
      circle.y = e.clientY;
    });

    const drawCircle = (x, y, radius) => {
      ctx.beginPath();
      ctx.arc(x, y, radius, Math.PI * 2, false);
      ctx.fill();
    };

    const animate = () => {
      ctx.clearRect(0, 0, canvas.width, canvas.height);
      drawCircle(circle.x, circle.y, circle.radius);
      requestAnimationFrame(animate);
    };
    animate();
  </script>
</html>
Canvas上の円をDrag&Drop
mouseイベントとrequestAnimationFrame関数を利用してCanvas上に表示されている円をDrag&Dropして移動させる方法を確認します。円の上でマウスをクリックしている間にはDragすることができ、マウスのクリックを外すとDropするように設定します。
dragging変数を定義してDragしている間(mousedown中)にはtrueに設定してmouseupをすると値をfalseにします。
 let dragging = false;

 canvas.addEventListener('mousedown', () => {
    dragging = true;
});

canvas.addEventListener('mouseup', () => {
    dragging = false;
});
canvas.addEventListener('mousemove', (e) => {
    if (dragging) {
      circle.x = e.clientX;
      circle.y = e.clientY;
    }
});
const animate = () => {
    if (dragging) {
      ctx.clearRect(0, 0, canvas.width, canvas.height);
      drawCircle(circle.x, circle.y, circle.radius);
    }
    requestAnimationFrame(animate);
};
animate();
<script>
    const canvas = document.getElementById('canvas');
    const ctx = canvas.getContext('2d');

    canvas.height = window.innerHeight;
    canvas.width = window.innerWidth;

    let dragging = false;

    const circle = {
      x: window.innerWidth / 2,
      y: window.innerHeight / 2,
      radius: 20,
    };

    const drawCircle = () => {
      ctx.beginPath();
      ctx.arc(circle.x, circle.y, circle.radius, 0, Math.PI * 2);
      ctx.fill();
    };

    drawCircle();

    canvas.addEventListener('mousedown', (e) => {
      dragging = true;
    });

    canvas.addEventListener('mouseup', () => {
      dragging = false;
    });

    canvas.addEventListener('mousemove', (e) => {
      if (dragging) {
        circle.x = e.clientX;
        circle.y = e.clientY;
      }
    });

    const animate = () => {
      if (dragging) {
        ctx.clearRect(0, 0, canvas.width, canvas.height);
        drawCircle(circle.x, circle.y, circle.radius);
      }
      requestAnimationFrame(animate);
    };
    animate();
</script>
円をクリックした場合にはDrag&Dropすることができますが円以外をクリックすると円がクリックした場所に移動して描写されDrag&Dropができるようになります。円をクリックした時のみDrag&Dropできるようにmousedownイベントにif文による条件を追加します。mousedownの行った位置が円の内部のみdragging変数の値をtrueにしています。
canvas.addEventListener("mousedown", (e) => {
  if (
    e.clientX > circle.x - circle.radius &&
    e.clientX < circle.x + circle.radius &&
    e.clientY > circle.y - circle.radius &&
    e.clientY < circle.y + circle.radius
  ) {
    dragging = true;
  }
});
更新後は円以外の場所をクリックしても円をDrag&Dropすることはできなくなります。
現在のコードでは円をクリックするとクリックした位置に円の中心が移動してきます。不自然な動作となりためマウスの位置と円の中心の位置を維持したままDrag&DropできるようにoffsetXとoffsetYの変数にずれを保存します。mousedownイベントで取得したoffsetXとoffsetYの値はmousemoveイベントの中でその値を反映させます。これで円をクリックしても円の中心がクリックした位置に移動することはなく自然な動きとなります。
<script>
const canvas = document.getElementById('canvas');
const ctx = canvas.getContext('2d');

canvas.height = window.innerHeight;
canvas.width = window.innerWidth;

let dragging = false;
let offsetX = 0;
let offsetY = 0;

const circle = {
    x: window.innerWidth / 2,
    y: window.innerHeight / 2,
    radius: 20,
};

const drawCircle = () => {
    ctx.beginPath();
    ctx.arc(circle.x, circle.y, circle.radius, 0, Math.PI * 2);
    ctx.fill();
};

drawCircle();

    canvas.addEventListener("mousedown", (e) => {
      if (
        e.clientX > circle.x - circle.radius &&
        e.clientX < circle.x + circle.radius &&
        e.clientY > circle.y - circle.radius &&
        e.clientY < circle.y + circle.radius
      ) {
        dragging = true;
        offsetX = e.clientX - circle.x;
        offsetY = e.clientY - circle.y;
      }
    });

canvas.addEventListener('mouseup', () => {
    dragging = false;
});

canvas.addEventListener('mousemove', (e) => {
    if (dragging) {
    circle.x = e.clientX - offsetX;
    circle.y = e.clientY - offsetY;
    }
});

const animate = () => {
    if (dragging) {
    ctx.clearRect(0, 0, canvas.width, canvas.height);
    drawCircle(circle.x, circle.y, circle.radius);
    }
    requestAnimationFrame(animate);
};
animate();
</script>
canvas上を動く円
新たにClassでCircleを定義してcanvas上を一定の速度で動く円を描写します。
Circle Classを以下のように定義します。drawメソッドでは描写する図形の設定を行い、updateメソッドでインスタンス時に与えられたdx, dy分円の位置をずらします。
class Circle {
    constructor(x, y, radius, dx, dy) {
      this.x = x;
      this.y = y;
      this.radius = radius;
      this.dx = dx;
      this.dy = dy;
    }
    draw() {
      ctx.beginPath();
      ctx.arc(this.x, this.y, this.radius, Math.PI * 2, false);
      ctx.fill();
    }
    update() {
      this.x += this.dx;
      this.y += this.dy;
      this.draw();
    }
}
定義したCircleクラスを利用してcircleインスタンスを作成します。animate関数の中でcircleインスタンスのupdateメソッドとdrawメソッドを実行します。requestAnimationFrameによりupdateメソッドが実行され位置が更新され、drawメソッドで更新した位置で円が表示されます。それを繰り返しcanvas上を動く円を描写することができます。
<script>
  const canvas = document.getElementById("canvas");
  const ctx = canvas.getContext("2d");

  canvas.height = window.innerHeight;
  canvas.width = window.innerWidth;

  class Circle {
    constructor(x, y, radius, dx, dy) {
      this.x = x;
      this.y = y;
      this.radius = radius;
      this.dx = dx;
      this.dy = dy;
    }
    draw() {
      ctx.beginPath();
      ctx.arc(this.x, this.y, this.radius, Math.PI * 2, false);
      ctx.fill();
    }
    update() {
      this.x += this.dx;
      this.y += this.dy;
      this.draw();
    }
  }

  const circle = new Circle(
    window.innerWidth / 2,
    window.innerHeight / 2,
    10,
    1,
    1
  );

  const animate = () => {
    ctx.clearRect(0, 0, canvas.width, canvas.height);

    circle.update();
    circle.draw();

    requestAnimationFrame(animate);
  };

  animate();
</script>
ブラウザで確認すると中心から右下に向かってゆっくりと移動する円が描写されます。
canvas上を動く複数の円
Classを利用してCircleを定義したので複数のCircleを一度にCanvas上で動かすことも簡単に行うことができます。作成する個々のCircleの情報を保存できるように配列のcirclesを定義します。100個の円を作成するためにfor loopで100個分のCircleインスタンスをCircle Classから作成します。作成する際にはランダムな場所からランダムな速度で移動できるように以下のようにMath.random関数を利用します。Math.random関数では0以上1未満のランダムな浮動小数点数を作成するため円の始点も移動の速度もそれぞれの円によって異なります。
const circles = [];

for (i = 0; i < 100; i++) {
    circles.push(
    new Circle(
        Math.random() * window.innerWidth,
        Math.random() * window.innerHeight,
        10,
        (Math.random() - 0.5) * 10,
        (Math.random() - 0.5) * 10
    )
    );
}
作成したcirclesの配列に保存された円の情報はanimate関数の中でupdateとdrawを繰り返します。
const animate = () => {
    ctx.clearRect(0, 0, canvas.width, canvas.height);

    for (let i = 0; i < circles.length; i++) {
      circles[i].update();
      circles[i].draw();
    }

    requestAnimationFrame(animate);
};

animate();
最初は100個分の円が表示されますが暫くするとすべての円がブラウザ外へと移動するのでブラウザ上には円がなくなります。
円がブラウザの内部で収まるように分岐を追加して円のx座標、y座標がCanvasの幅を超えているか、または0未満になっていないかをチェックしてその条件に当てはまる場合には移動の方向が逆方向になるように設定します。
<!DOCTYPE html>
<html>
  <head>
    <meta charset="UTF-8" />
    <meta name="viewport" content="width=device-width, initial-scale=1.0" />
  </head>
  <body>
    <canvas id="canvas"></canvas>
  </body>
  <script>
    const canvas = document.getElementById('canvas');
    const ctx = canvas.getContext('2d');

    canvas.height = window.innerHeight;
    canvas.width = window.innerWidth;

    const circles = [];

    class Circle {
      constructor(x, y, radius, dx, dy) {
        this.x = x;
        this.y = y;
        this.radius = radius;
        this.dx = dx;
        this.dy = dy;
      }

      draw() {
        ctx.beginPath();
        ctx.arc(this.x, this.y, this.radius, Math.PI * 2, false);
        ctx.fill();
      }
      update() {
        if (this.x + this.radius > canvas.width || this.x - this.radius < 0) {
          this.dx = -this.dx;
        }
        if (this.y + this.radius > canvas.height || this.y - this.radius < 0) {
          this.dy = -this.dy;
        }
        this.x += this.dx;
        this.y += this.dy;
        this.draw();
      }
    }

    for (i = 0; i < 100; i++) {
      circles.push(
        new Circle(
          Math.random() * window.innerWidth,
          Math.random() * window.innerHeight,
          10,
          (Math.random() - 0.5) * 10,
          (Math.random() - 0.5) * 10
        )
      );
    }

    const animate = () => {
      ctx.clearRect(0, 0, canvas.width, canvas.height);

      for (let i = 0; i < circles.length; i++) {
        circles[i].update();
        circles[i].draw();
      }

      requestAnimationFrame(animate);
    };

    animate();
  </script>
</html>
設定前は一定時間が経過するとすべての円はブラウザの外側に消えていきましたが設定後はブラウザ内にすべての円が収まるように移動します。
表示されている円を区別する方法
canvas上の円そのものにイベントを設定することはできません。ではその中のある一つの円のみユーザからのインタラクションで設定を更新したい場合はどのように行えばよいのでしょう。ここでは円をクリックするとその円の色が変わるという動作を通して円を区別する方法を確認します。
円の色を変更できるようにCircle Classにcolorプロパティを持たせ、changeChangeメソッドで変更できるようにします。
class Circle {
    constructor(x, y, radius, color) {
      this.x = x;
      this.y = y;
      this.radius = radius;
     this.color = color;
    }

    draw() {
      ctx.beginPath();
      ctx.arc(this.x, this.y, this.radius, Math.PI * 2, false);
      ctx.fillStyle = this.color;
      ctx.fill();
    }
    changeColor(color) {
      this.color = color;
    }
}
10個の円を描写できるように設定を行います。色は赤に設定を行っています。
for (i = 0; i < 10; i++) {
  circles.push(
    new Circle(
      Math.random() * window.innerWidth,
      Math.random() * window.innerHeight,
      20,
      "red"
    )
  );
}

for (let i = 0; i < circles.length; i++) {
  circles[i].draw();
}
canvas全体にclickイベントを設定します。clickイベントの中ではマウスがクリックした位置が表示されている円の中に含まれているのかチェックを行っています。マウスの位置がその円の中に入っていればその円がクリックされたこととしchageColorメソッドを利用して円の色を"blue"に変更します。
canvas.addEventListener('click', (e) => {
  for (let i = 0; i < circles.length; i++) {
    if (
      e.clientX > circles[i].x - circles[i].radius &&
      e.clientX < circles[i].x + circles[i].radius &&
      e.clientY > circles[i].y - circles[i].radius &&
      e.clientY < circles[i].y + circles[i].radius
    ) {
      circles[i].changeColor('blue');
    }
  }
  ctx.clearRect(0, 0, canvas.width, canvas.height);
  for (let i = 0; i < circles.length; i++) {
    circles[i].draw();
  }
});
ブラウザに描写されている円をクリックするとクリックした円のみ色が変わることが確認できます。
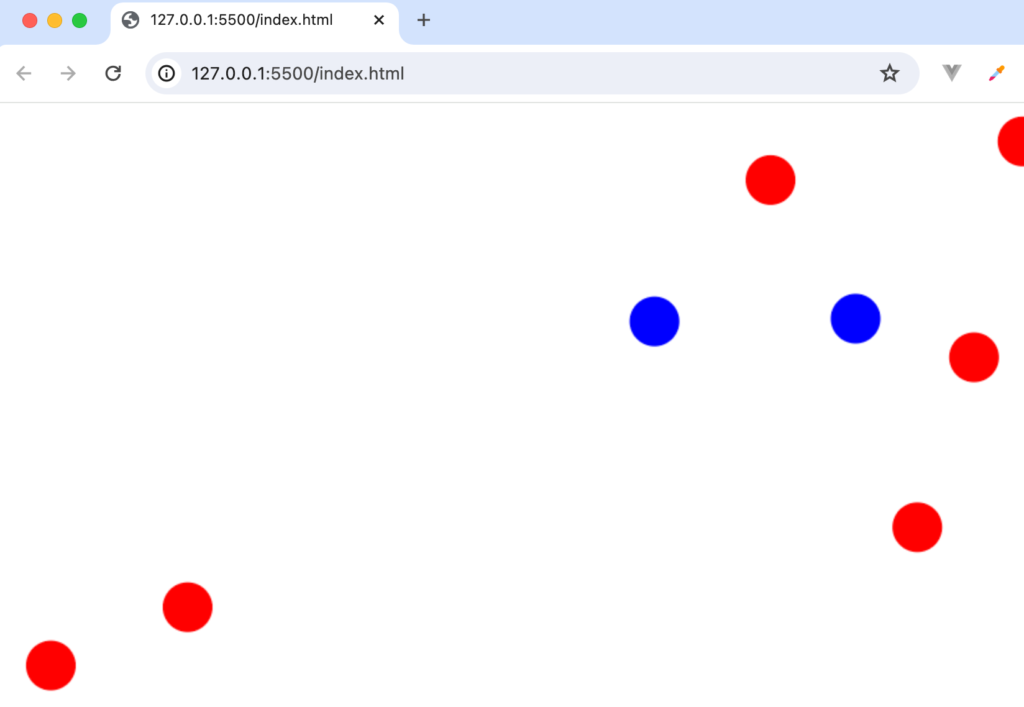
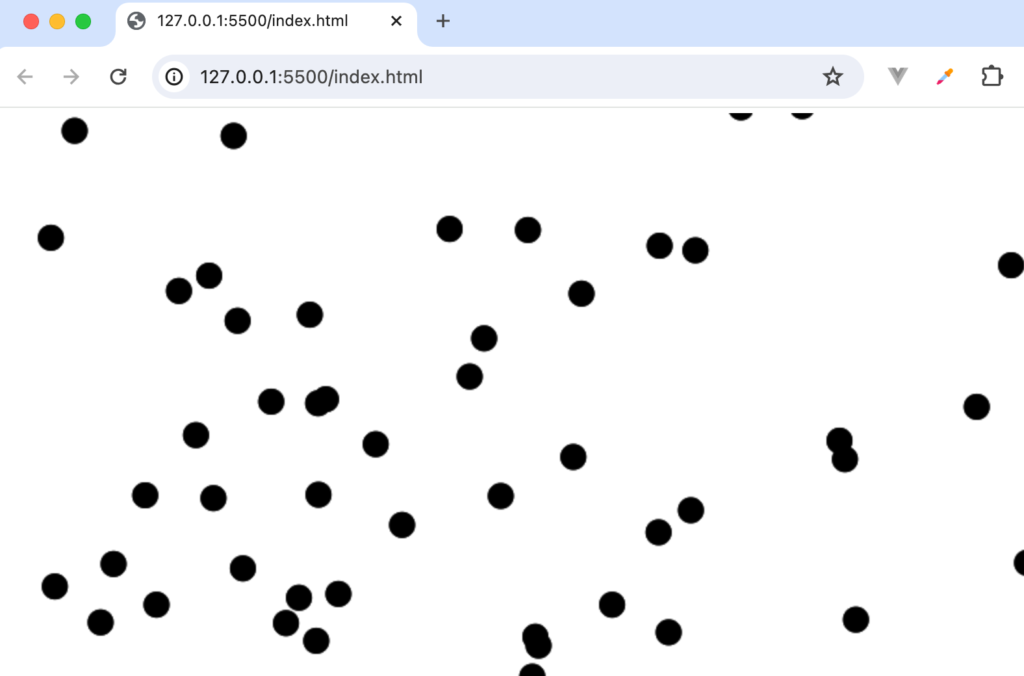
リロードを行っていくと2つの円が重なる場合があります。その場合2つの円が重なる部分をクリックすると1回のクリックで2つの円の色が変わります。
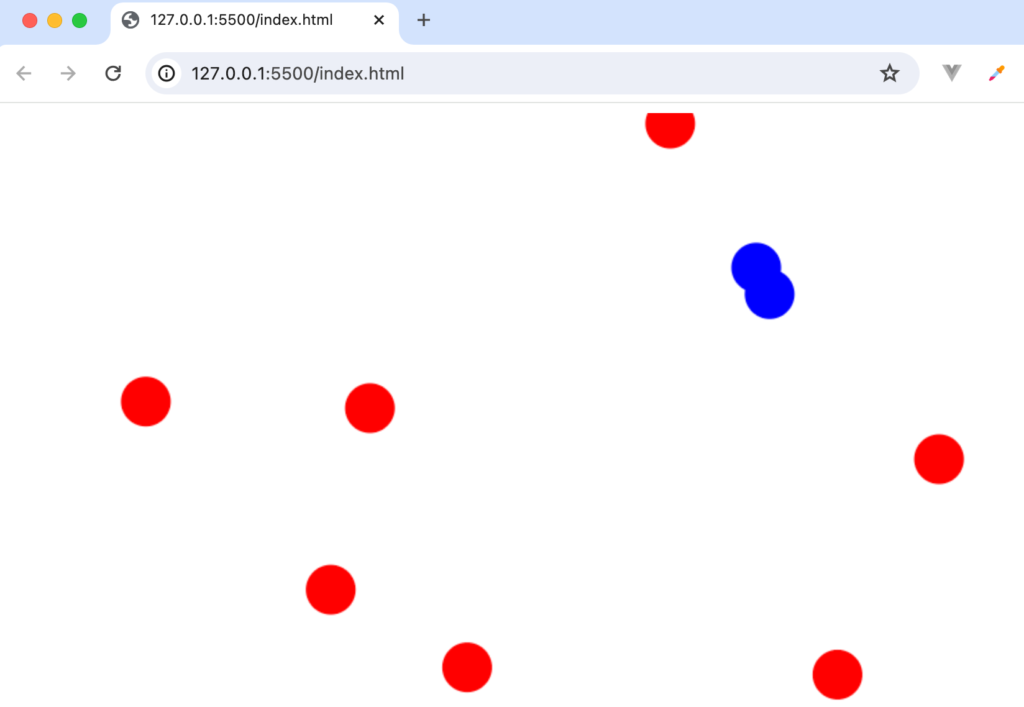
重なりあう複数の円を同時に選択しないためにはcanvas上での図形の重なり順について理解しておく必要があります。canvasでは最初に描写された図形が一番下になり、最後に描写された図形が一番上になります。circles配列をfor loopを利用して先頭から順番に描写しているので配列の先頭が一番下、配列の最後が一番上になります。重なりあう複数の円を同時に選択しないためにはaddEventListenerでif文の条件に一致する最後の要素のみ色を変えるように変更する必要があります。
コードにtopLayerIndexの変数を追加します。条件に一致する円が複数ある場合はtopLayerIndexの値は上書きされるので最後に保存された値が重なっている円で一番上の円となります。
canvas.addEventListener('click', (e) => {
  let topLayerIndex = -1;
  for (let i = 0; i < circles.length; i++) {
    if (
      e.clientX > circles[i].x - circles[i].radius &&
      e.clientX < circles[i].x + circles[i].radius &&
      e.clientY > circles[i].y - circles[i].radius &&
      e.clientY < circles[i].y + circles[i].radius
    ) {
      topLayerIndex = i;
    }
  }

  if (topLayerIndex !== -1) {
    circles[topLayerIndex].changeColor('blue');
  }
  ctx.clearRect(0, 0, canvas.width, canvas.height);
  for (let i = 0; i < circles.length; i++) {
    circles[i].draw();
  }
});
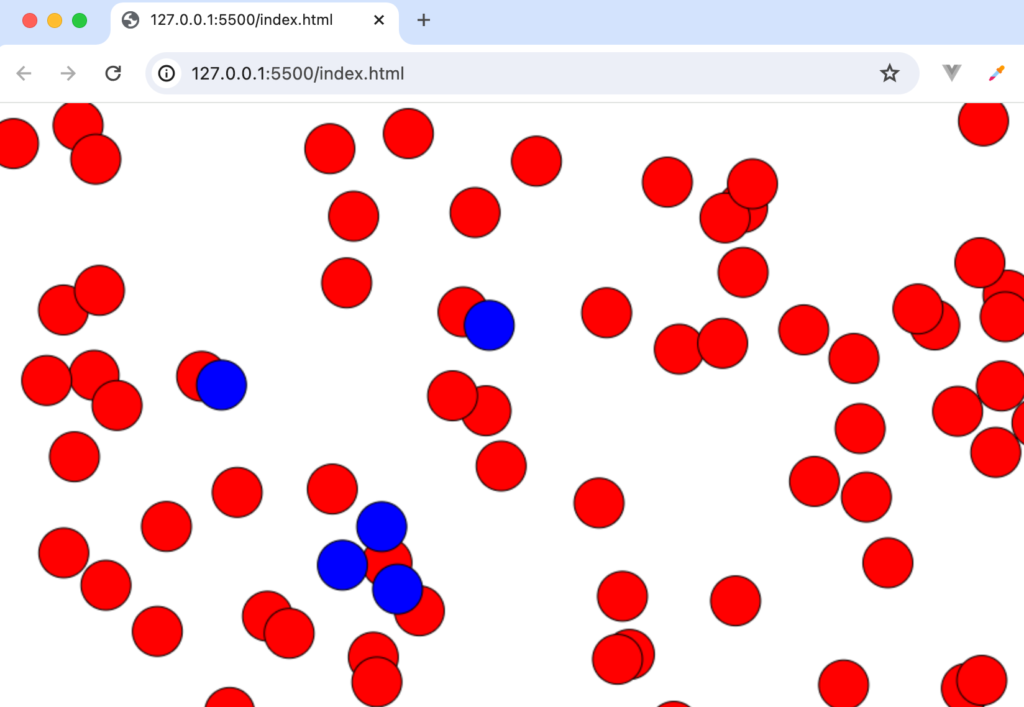
円の重なりがわかるように円にStrokeを設定しています。また重なる確率が増えるように表示する要素の数も増やしています。
<script>
  const canvas = document.getElementById('canvas');
  const ctx = canvas.getContext('2d');
  canvas.style.position = 'absolute';
  canvas.style.top = '0';
  canvas.style.left = '0';

  canvas.height = window.innerHeight;
  canvas.width = window.innerWidth;

  const circles = [];

  class Circle {
    constructor(x, y, radius, color) {
      this.x = x;
      this.y = y;
      this.radius = radius;
      this.color = color;
    }

    draw() {
      ctx.beginPath();
      ctx.arc(this.x, this.y, this.radius, Math.PI * 2, false);
      ctx.fillStyle = this.color;
      ctx.strokeStyle = 'black';
      ctx.fill();
      ctx.stroke();
    }
    changeColor(color) {
      this.color = color;
    }
  }

  for (i = 0; i < 100; i++) {
    circles.push(
      new Circle(
        Math.random() * window.innerWidth,
        Math.random() * window.innerHeight,
        20,
        'red'
      )
    );
  }

  for (let i = 0; i < circles.length; i++) {
    circles[i].draw();
  }

  canvas.addEventListener('click', (e) => {
    let topLayerIndex = -1;
    for (let i = 0; i < circles.length; i++) {
      if (
        e.clientX > circles[i].x - circles[i].radius &&
        e.clientX < circles[i].x + circles[i].radius &&
        e.clientY > circles[i].y - circles[i].radius &&
        e.clientY < circles[i].y + circles[i].radius
      ) {
        topLayerIndex = i;
      }
    }

    if (topLayerIndex !== -1) {
      circles[topLayerIndex].changeColor('blue');
    }
    ctx.clearRect(0, 0, canvas.width, canvas.height);
    for (let i = 0; i < circles.length; i++) {
      circles[i].draw();
    }
  });
</script>
設定後は重なった部分をクリックしても一番上にある円のみ色が変わるようになります。
ここまでの動作確認でcanvas上での図形の重なり順と図形を区別する方法を理解することができました。
Bar Chartを描写してみよう
JavaScriptのチャートライブラリの中で人気のライブラリの一つであるChart.jsなどでもチャートを描く際にcanvas要素を利用しています。ここではChart.jsなどのライブラリを利用することなくcanvas上にBar Chartを描写する方法を確認していきます。
Barを描く
Bar Chart(棒グラフ)は名前の通りBar(棒)を利用してチャートを作成します。Barは四角の図形を利用して描くことができるのでこれまでの知識を利用してBarを描写します。
最初にBar Chartを描写するcanvasを用意します。
<!DOCTYPE html>
<html>
  <head>
    <meta charset="UTF-8" />
    <meta name="viewport" content="width=device-width, initial-scale=1.0" />
  </head>
  <body>
    <canvas id="canvas"></canvas>
  </body>
  <script>
    const canvas = document.getElementById('canvas');
    const ctx = canvas.getContext('2d');
    canvas.width = window.innerWidth;
    canvas.height = window.innerHeight;
  </script>
</html>
Canvas上にBar Chartの一部となる四角の図形を描写するdrawRect関数を追加します。
const drawRect = (x, y, width, height) => {
  ctx.beginPath();
  ctx.rect(x, y, width, height);
  ctx.stroke();
};
Bar Chartに利用するデータを配列で定義します。
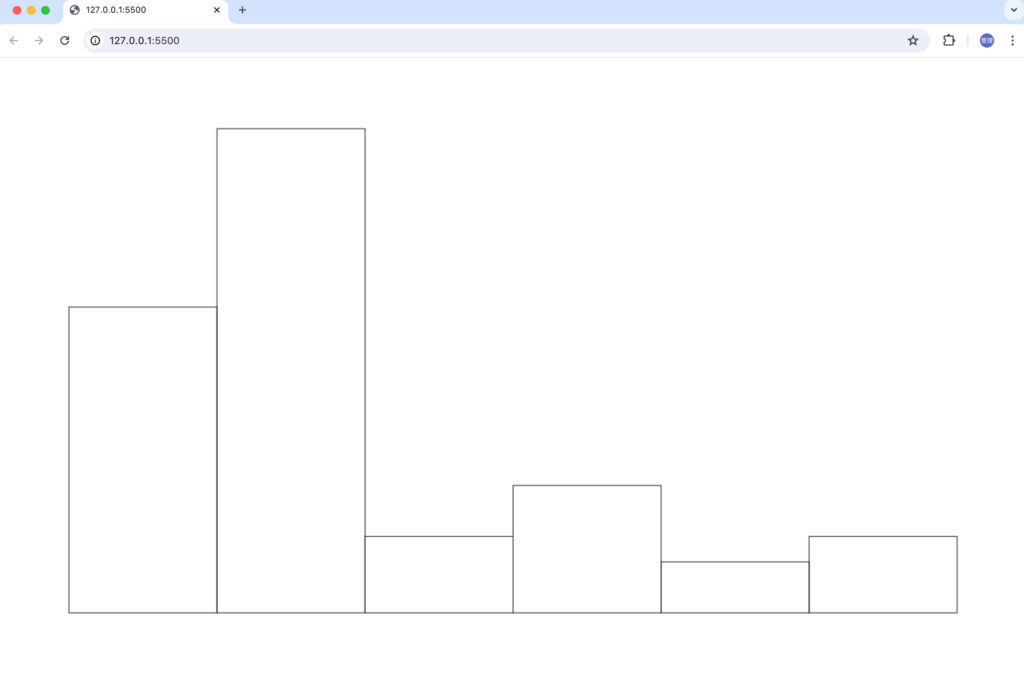
const data = [12, 19, 3, 5, 2, 3];
Bar Chartを描写するためにBarChart Classを作成します。
各Barの幅はブラウザのウィンドウサイズの幅をデータの配列の要素分で割り計算します。ウィンドウサイズの幅が1000pxでデータの数が5つの場合はBarの幅は1000/5の200pxとなります。
各Barの高さは配列の中の最大値でブラウザのウィンドウサイズの高さを割って出た高さに各要素の値をかけることで計算します。ウィンドウサイズの高さが1000pxで最大値が20の場合、高さは1000/20の50となり、20*50が最大値のBarの高さになります。
四角の始点となるx座標はBarの幅毎右にずれていくので配列dataのforEachのloopのindexをかけて計算します。四角の始点のy座標はブラウザのウィンドウサイズの高さからそのバーの高さを引いて計算します。コードにすると以下になります。インスタンス化する際の初期値にはdataを引数で渡します。
class BarChart {
  constructor(data) {
    this.data = data;
  }

  drawBars() {
    this.barWidth = canvas.width / data.length;
    this.barHeight = canvas.height / Math.max(...data);
    this.data.forEach((value, index) => {
      const x = index * this.barWidth;
      const y = canvas.height - value * this.barHeight;
      drawRect(x, y, this.barWidth, value * this.barHeight);
    });
  }
}
Barを描写する際はBarChart Classをインスタンス化してdrawBarsメソッドを実行します。
const barChart = new BarChart(data);

barChart.drawBars();
ブラウザで確認するとdataの要素分のBarが各要素の値に比例した高さで表示されます。
ブラウザのウィンドウのサイズを変更しても変更に合わせてBar Chartが再描写されるようにresizeイベントを利用します。resizeイベントの中で再描写を行いためBarChart ClassのdrawBarsメソッドを実行します。
window.addEventListener('resize', () => {
  canvas.width = window.innerWidth;
  canvas.height = window.innerHeight;
  barChart.drawBars();
});
resizeイベントを追加するとがブラウザのサイズを変更するとブラウザのサイズに合わせてBar Chartも再描写されます。
Bar Chartの周りにスペースを追加
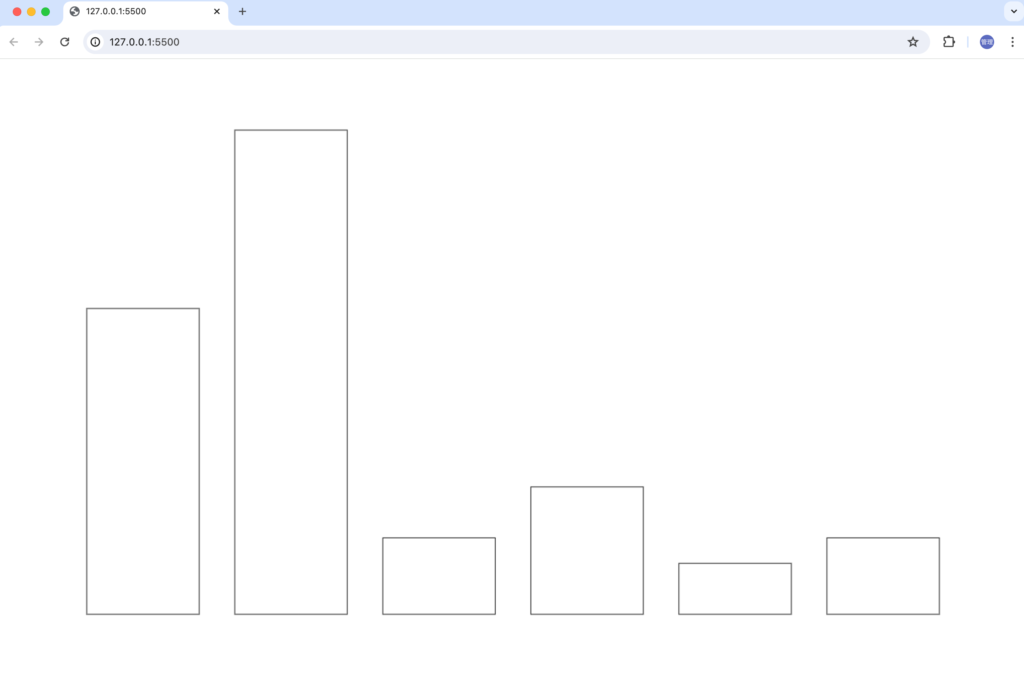
Bar Chartの幅と高さの計算にウィンドウサイズのwindow.innerWidthとwindow.innerHightを利用しているので画面一般にBar Chartが広がっているので周りにスペースを追加します。
BarChart Classにプロパティのpaddingを追加します。デフォルトでは100としています。Barの幅や高さ、Barの位置の計算にpaddingの値を追加しています。
class BarChart {
  constructor(data, padding = 100) {
    this.data = data;
    this.padding = padding;
  }

  drawBars() {
    const barWidth = (canvas.width - this.padding * 2) / data.length;
    const barHeight =
      (canvas.height - this.padding * 2) / Math.max(...data);
    this.data.forEach((value, index) => {
      const x = this.padding + index * barWidth;
      const y = canvas.height - value * barHeight - this.padding;
      drawRect(x, y, barWidth, value * barHeight);
    });
  }
}
Bar Chartの上下左右にスペースが確認できます。
Barの間のスペースの設定
BarとBarの間にもスペースを追加するためにBarChart Classにgapプロパティを追加します。Barの幅にgapの値を反映できるようにdataWidthを追加してgapの幅分を取り除いた幅をbarWidthに保存します。
class BarChart {
  constructor(data, padding = 100, gap = 25) {
    this.data = data;
    this.padding = padding;
    this.gap = gap;
  }

  drawBars() {
    const dataWidth = (canvas.width - this.padding * 2) / data.length;
    const barWidth = dataWidth - this.gap * 2;
    const barHeight =
      (canvas.height - this.padding * 2) / Math.max(...data);
    this.data.forEach((value, index) => {
      const x = this.padding + index * dataWidth;
      const y = canvas.height - value * barHeight - this.padding;
      drawRect(this.gap + x, y, barWidth, value * barHeight);
    });
  }
}
gapを追加した後はBarの間にgapで設定したスペースが追加されます。
BarChartの引数にpaddingとgapのデフォルト以外の値を入れて期待通りの表示になるか確認してください。
Y軸の描写
canvas上にY軸を描写させるためdrawLine関数を追加します。x1,y1からx2,y2に対して直線を描写する関数です。
const drawLine = (x1, y1, x2, y2, color = '#ddd') => {
  ctx.beginPath();
  ctx.moveTo(x1, y1);
  ctx.lineTo(x2, y2);
  ctx.strokeStyle = color;
  ctx.stroke();
};
Y軸を描写するためのdrawYAxisメソッドをBarChart Classに追加します。darwYAxisメソッドの中でもdrawBarsメソッドで計算したdataWidthを利用するのでdataWidth, barWidth, barHeightをBar Chart Classのプロパティとして設定します。
drawYAxis() {
  let x = 0;
  this.data.forEach((value, index) => {
    x = index * this.dataWidth + this.padding;
    drawLine(x, canvas.height - this.padding, x, this.padding);
  });
  x = data.length * this.dataWidth + this.padding;
  drawLine(x, canvas.height - this.padding, x, this.padding);
}
dataWidth, barWidth, barHeightプロパティを加えたBarChart Classを以下のように更新します。
class BarChart {
  constructor(data, padding = 100, gap = 25) {
    this.data = data;
    this.padding = padding;
    this.gap = gap;
    this.dataWidth = 0;
    this.barWidth = 0;
    this.barHeight = 0;
  }

  drawBars() {
    this.dataWidth = (canvas.width - this.padding * 2) / data.length;
    this.barWidth = this.dataWidth - this.gap * 2;
    this.barHeight =
      (canvas.height - this.padding * 2) / Math.max(...data);
    this.data.forEach((value, index) => {
      const x = this.padding + index * this.dataWidth;
      const y = canvas.height - value * this.barHeight - this.padding;
      drawRect(this.gap + x, y, this.barWidth, value * this.barHeight);
    });
  }

  drawYAxis() {
    let x = 0;
    this.data.forEach((value, index) => {
      x = index * this.dataWidth + this.padding;
      drawLine(x, window.innerHeight - this.padding, x, this.padding);
    });
    x = data.length * this.dataWidth + this.padding;
    drawLine(x, window.innerHeight - this.padding, x, this.padding);
  }
}
BarChart Classをインスタンス化した後、drawBarsメソッドとdrawYAxisメソッドを実行します。
const barChart = new BarChart(data);

barChart.drawBars();
barChart.drawYAxis();

window.addEventListener('resize', () => {
  canvas.width = window.innerWidth;
  canvas.height = window.innerHeight;
  barChart.drawBars();
  barChart.drawYAxis();
});
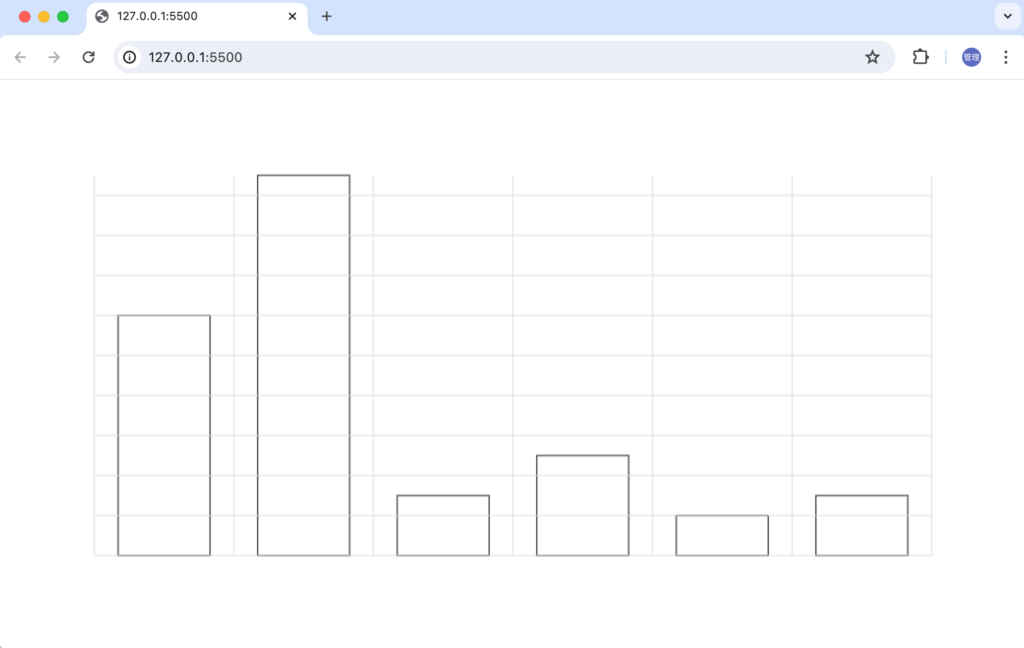
ブラウザで確認するとY軸を確認することができます。

X軸の描写
X軸を描写するためのdrawXAxisメソッドをBarChart Classに追加します。canvas上にY軸を描写させるため定義済みのdrawLine関数を利用します。最初のX軸の線はBar Chartの底から開始して、Bar Chartの高さを配列の最大値をtickで掛けた値を減らして、yの値がpaddingの値を超えないようにwhile loopを実行しています。
drawXAxis() {
  let y = canvas.height - this.padding;
  while (y >= this.padding) {
    drawLine(this.padding, y, canvas.height - this.padding, y);
    y -= this.barHeight * this.tick;
  }
}
X軸の描写の間隔を指定できるようにするためにBarChart Classにtickプロパティを追加します。デフォルト値は2としています。
class BarChart {
  constructor(data, padding = 100, gap = 25, tick = 2) {
    this.data = data;
    this.padding = padding;
    this.gap = gap;
    this.tick = tick;
    this.dataWidth = 0;
    this.barWidth = 0;
    this.barHeight = 0;
  }
//略
drawXAxisメソッドとtickを追加したBarChart Classは以下のようになります。
class BarChart {
  constructor(data, padding = 100, gap = 25, tick = 2) {
    this.data = data;
    this.padding = padding;
    this.gap = gap;
    this.tick = tick;
    this.dataWidth = 0;
    this.barWidth = 0;
    this.barHeight = 0;
  }

  drawBars() {
    this.dataWidth = (canvas.width - this.padding * 2) / data.length;
    this.barWidth = this.dataWidth - this.gap * 2;
    this.barHeight =
      (canvas.height - this.padding * 2) / Math.max(...data);
    this.data.forEach((value, index) => {
      const x = this.padding + index * this.dataWidth;
      const y = canvas.height - value * this.barHeight - this.padding;
      drawRect(this.gap + x, y, this.barWidth, value * this.barHeight);
    });
  }

  drawXAxis() {
    let y = canvas.height- this.padding;
    while (y >= this.padding) {
      drawLine(this.padding, y, canvas.width - this.padding, y);
      y -= this.barHeight * this.tick;
    }
  }

  drawYAxis() {
    let x = 0;
    this.data.forEach((value, index) => {
      x = index * this.dataWidth + this.padding;
      drawLine(x, canvas.height - this.padding, x, this.padding);
    });
    x = data.length * this.dataWidth + this.padding;
    drawLine(x, canvas.height - this.padding, x, this.padding);
  }
}
BarChart Clasをインスタンス化して、drawBarsメソッド, drawXAxisメソッド, drawYAxisメソッドを実行します。
const barChart = new BarChart(data);

barChart.drawBars();
barChart.drawXAxis();
barChart.drawYAxis();

window.addEventListener('resize', () => {
  canvas.width = window.innerWidth;
  canvas.height = window.innerHeight;
  barChart.drawBars();
  barChart.drawXAxis();
  barChart.drawYAxis();
});
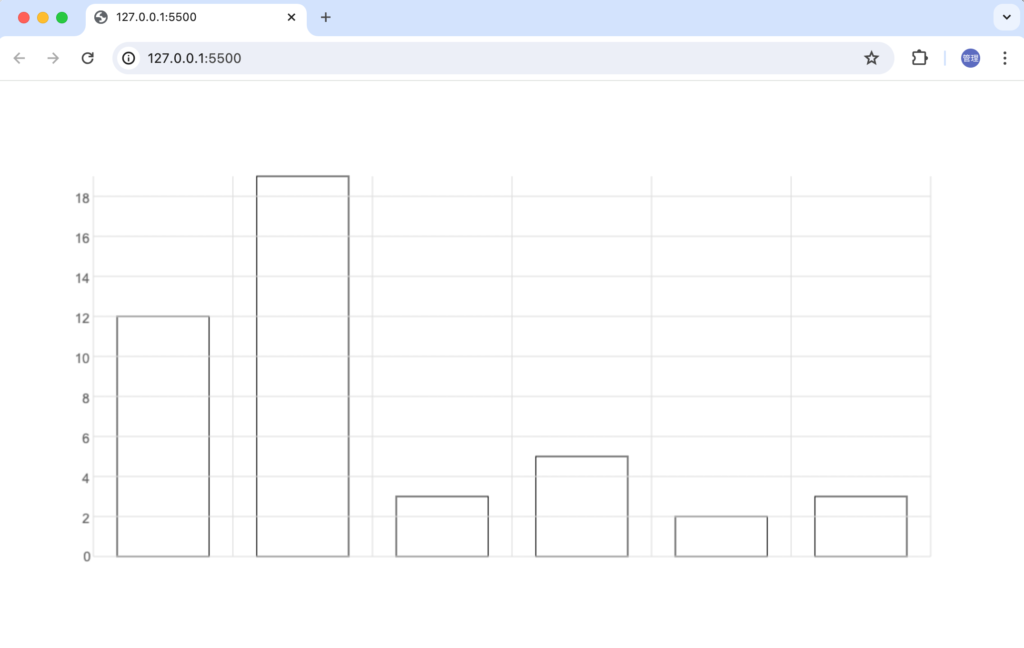
ブラウザで確認するとX軸が描写されていることが確認できます。
Y軸への目盛りの追加
左側のY軸に目盛りが描写されるように設定を行います。
文字をCanvas上に描写するためのdrawText関数を追加します。
const drawText = (text, x, y) => {
  ctx.beginPath();
  ctx.fillStyle = "#666";
  ctx.font = "14px Arial";
  ctx.fillText(text, x, y);
};
Y軸への目盛りの描写はdrawXAxisメソッド内で行います。
drawXAxis() {
  let index = 0;
  let y = canvas.height - this.padding;
  while (y >= this.padding) {
    drawLine(this.padding, y, canvas.width - this.padding, y);
    drawText(index * this.tick, this.padding, y);
    y -= this.barHeight * this.tick;
    index++;
  }
}
ブラウザで確認すると文字がY軸の内側に描写されていることが確認できます。ctx.fillTextメソッドでは文字の左下がx,yになるためです。
目盛りの位置をずらすため文字の幅と高さを計算します。文字の幅はctx.measureTextを利用します。文字の高さはctx.fontを利用します。
drawXAxis() {
  let index = 0;
  let y = canvas.height - this.padding;
  while (y >= this.padding) {
    drawLine(this.padding, y, canvas.width - this.padding, y);
    const labelWidth = ctx.measureText(index * this.tick).width;
    const fontSize = parseInt(ctx.font);
    drawText(
      index * this.tick,
      this.padding - labelWidth,
      y + fontSize / 2
    );
    y -= this.barHeight * this.tick;
    index++;
  }
}
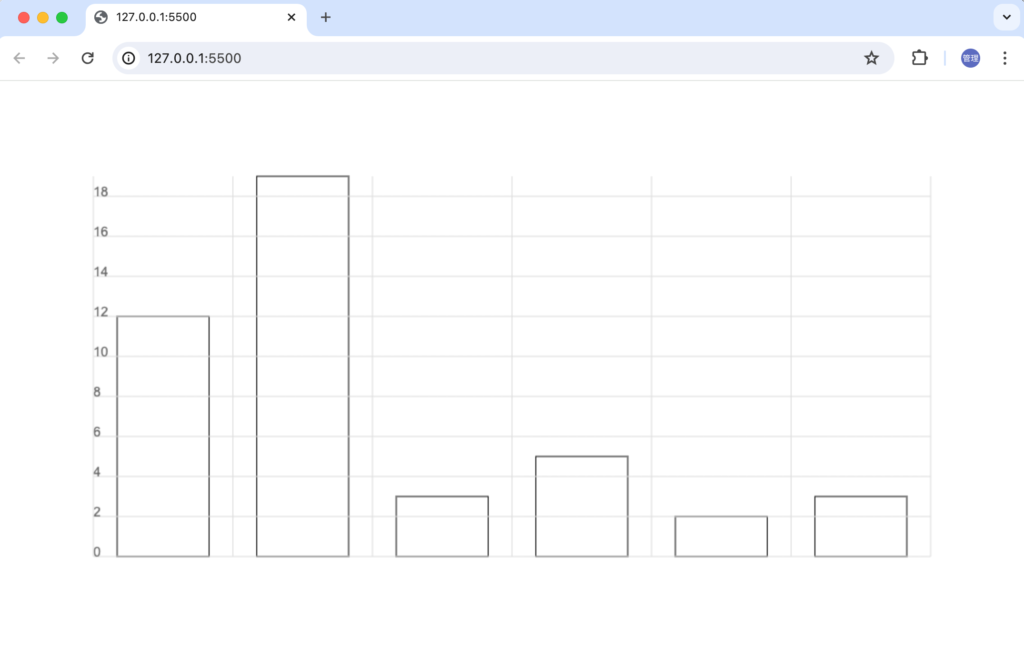
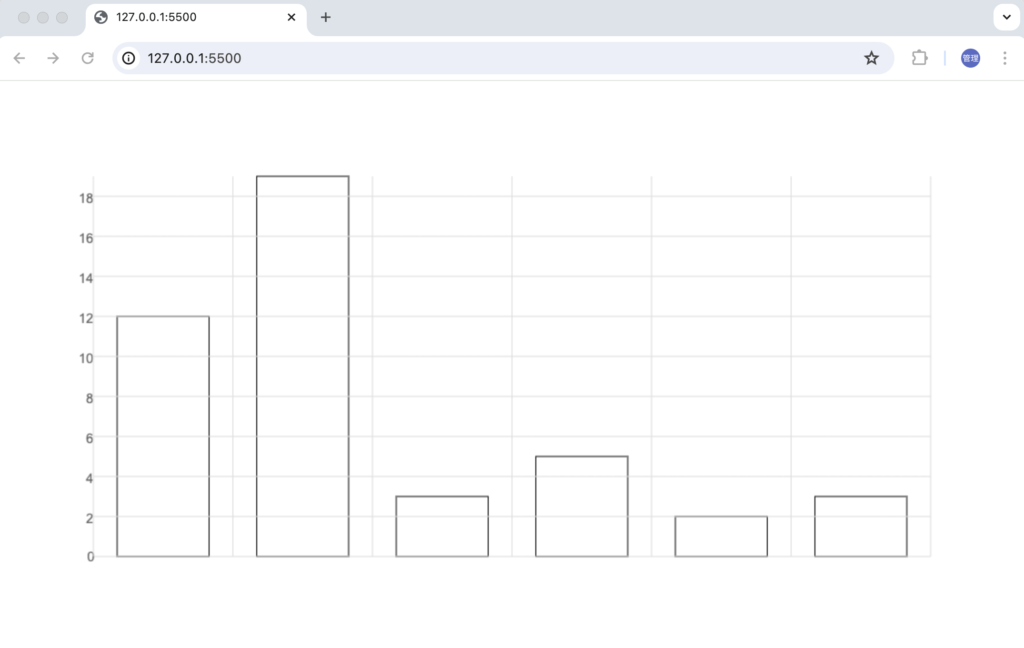
ブラウザで確認すると目盛りの位置が変わりY軸にぴったりとくっついて表示されます。
少しY軸と目盛りの間にスペースを空けるため調整を行います。
drawXAxis() {
  let index = 0;
  let y = canvas.height - this.padding;
  while (y >= this.padding) {
    drawLine(this.padding, y, canvas.width- this.padding, y);
    const labelWidth = ctx.measureText(index * this.tick).width;
    const labelHeight = parseInt(ctx.font);
    drawText(
      index * this.tick,
      this.padding - labelWidth - 4,
      y + labelHeight / 2
    );
    y -= this.barHeight * this.tick;
    index++;
  }
}
指定した通りに目盛りが描写されるようになりました。
X軸のLabelの描写
Y軸には目盛りを描写しましたがX軸には各データのLabelを設定します。Label情報を定義します。定義したlabelsはBarChartのlabelsプロパティとして設定します。
const data = [12, 19, 3, 5, 2, 3];
const labels = ['red', 'blue', 'green', 'purple', 'orange', 'yellow'];

class BarChart {
  constructor(data, labels, padding = 100, gap = 25, tick = 2) {
    this.data = data;
    this.labels = labels;
    this.padding = padding;
    this.gap = gap;
    this.tick = tick;
    this.dataWidth = 0;
    this.barWidth = 0;
    this.barHeight = 0;
  }
//略
BarChart ClassにdrawLabels関数を追加します。Labelは各Barの中心に表示されるように文字の幅とフォントのサイズを利用して描写します。
drawLabels() {
  this.labels.forEach((label, index) => {
    const x = index * this.dataWidth + this.padding;
    const labelWidth = ctx.measureText(label).width;
    const labelHeight = parseInt(ctx.font);
    drawText(
      this.labels[index],
      x + this.dataWidth / 2 - labelWidth / 2,
      canvas.height - this.padding + labelHeight
    );
  });
}
BarChartをインスタンス化する際の引数に定義したlabelsを設定して、drawLabelsメソッドを実行します。
const barChart = new BarChart(data, labels);

barChart.drawBars();
barChart.drawXAxis();
barChart.drawYAxis();
barChart.drawLabels();

window.addEventListener('resize', () => {
  canvas.width = window.innerWidth;
  canvas.height = window.innerHeight;
  barChart.drawBars();
  barChart.drawXAxis();
  barChart.drawYAxis();
  barChart.drawLabels();
});
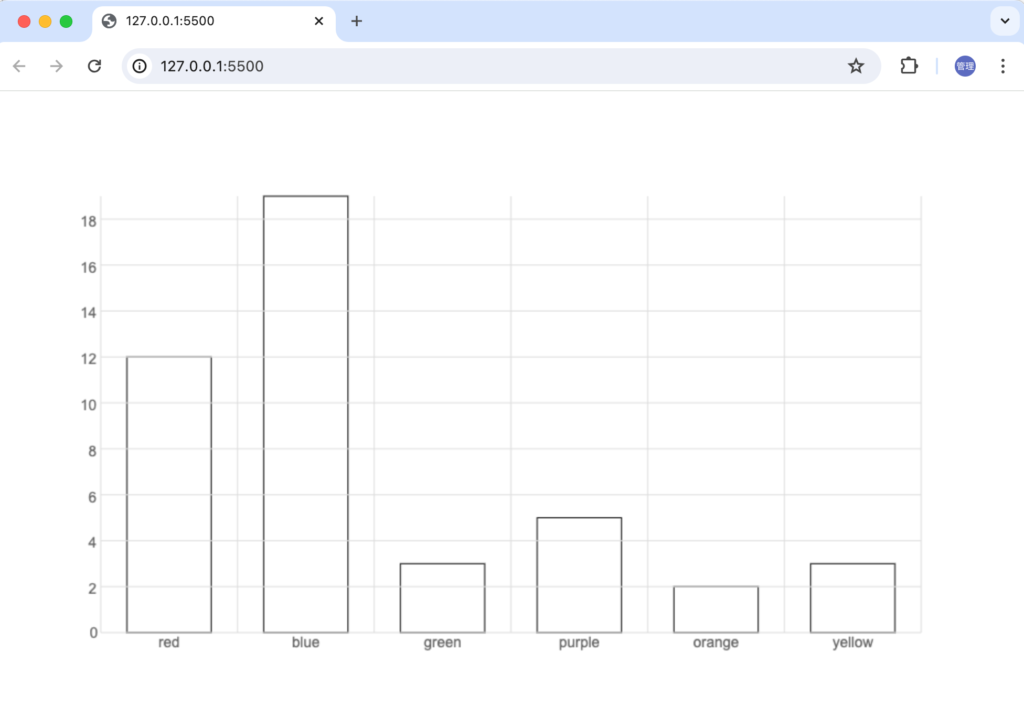
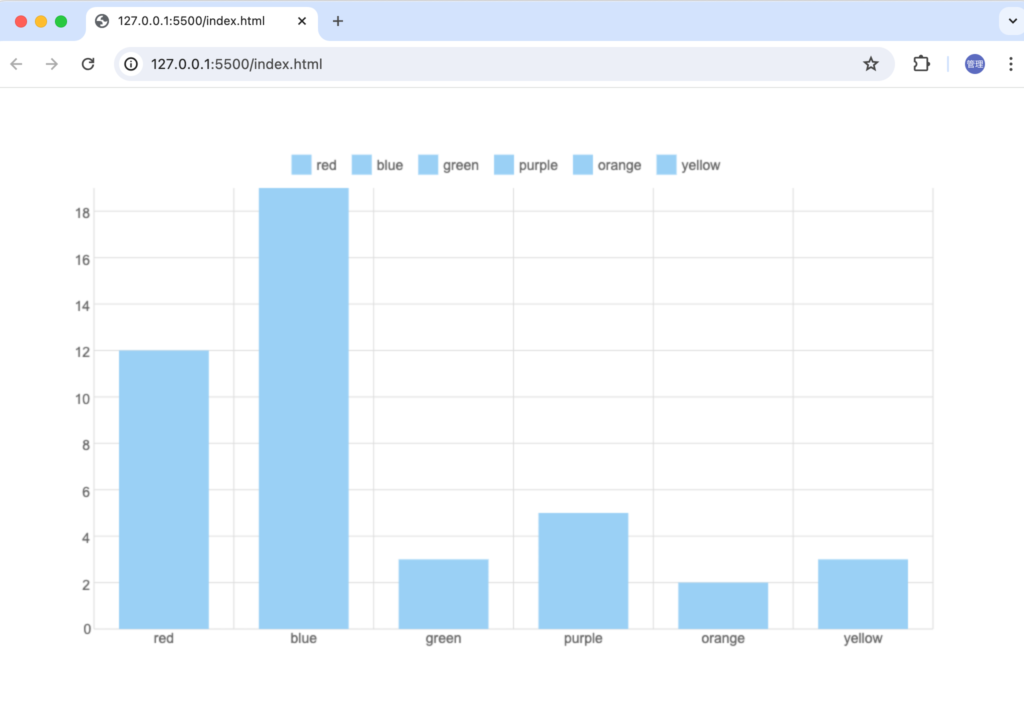
ブラウザで確認するとX軸にLabelが描写されていることが確認できます。
Barの色を設定する
Barに色を設定したい場合にはdrawRect関数で行うことができます。ctx.strokeメソッドからctx.fillStyleメソッドに変更します。
const drawRect = (x, y, width, height) => {
  ctx.beginPath();
  ctx.rect(x, y, width, height);
  // ctx.stroke();
  ctx.fillStyle = 'rgb(154,208,245)';
  ctx.fill();
};
Barに色を設定することができましたがBarの上にX軸の線が重なって表示されています。canvasでは最初に描写された図形が一番下になり、最後に描写された図形が一番上になります。先にBarが描写され、その後X軸の線が描写されていることが原因です。

drawBarsメソッドの中で実行されているdata.Widthなどの変数の値をdrawXAxisメソッドやdrawYAxisメソッドで利用しているためdataWidth, barWidth, barHeightの計算をdrawBarsメソッドの外に出し新たに追加するinitメソッドの中で実行させます。
init() {
  this.dataWidth = (canvas.width - this.padding * 2) / data.length;
  this.barWidth = this.dataWidth - this.gap * 2;
  this.barHeight = (canvas.height - this.padding * 2) / Math.max(...data);
}

drawBars() {
  this.data.forEach((value, index) => {
    const x = this.padding + index * this.dataWidth;
    const y = canvas.height - value * this.barHeight - this.padding;
    drawRect(this.gap + x, y, this.barWidth, value * this.barHeight);
  });
}
drawBars、drawXAxisなどの実行の順番を変更します。
const barChart = new BarChart(data, labels);

barChart.init();
barChart.drawXAxis();
barChart.drawYAxis();
barChart.drawLabels();
barChart.drawBars();

window.addEventListener('resize', () => {
  canvas.width = window.innerWidth;
  canvas.height = window.innerHeight;
  barChart.init();
  barChart.drawXAxis();
  barChart.drawYAxis();
  barChart.drawLabels();
  barChart.drawBars();
});
変更後にブラウザで確認するとBarの下側にX軸の線が表示されるようになります。
Legend(凡例)の設定
Bar Chartの各Barの情報を表示するためのLegendの設定を行います。BarChart ClassにdrawLegendメソッドを追加します。
BarChartの上部のpaddingの中央にLegend全体が表示されるように調整を行っています。
drawLegend() {
  let legendLength = 0;
  this.labels.forEach((label) => {
    legendLength += ctx.measureText(label).width + 40;
  });
  let x = canvas.width / 2 - legendLength / 2;
  const y = (this.padding * 2) / 3;
  this.labels.forEach((label, index) => {
    drawRect(x, y, 20, 20);
    const textWidth = ctx.measureText(label).width;
    drawText(label, x + 25, y + 15);
    x += textWidth + 40;
  });
}
BarChart ClassにdrawLegend関数を追加後、BarChartのインスタンス作成後に実行します。
const barChart = new BarChart(data, labels);

barChart.init();
barChart.drawXAxis();
barChart.drawYAxis();
barChart.drawLabels();
barChart.drawLegend();
barChart.drawBars();

window.addEventListener('resize', () => {
  canvas.width = window.innerWidth;
  canvas.height = window.innerHeight;
  barChart.init();
  barChart.drawXAxis();
  barChart.drawYAxis();
  barChart.drawLabels();
  barChart.drawLegend();
  barChart.drawBars();
});
ブラウザで確認するとBar Chartの上部にLegendが描写されます。
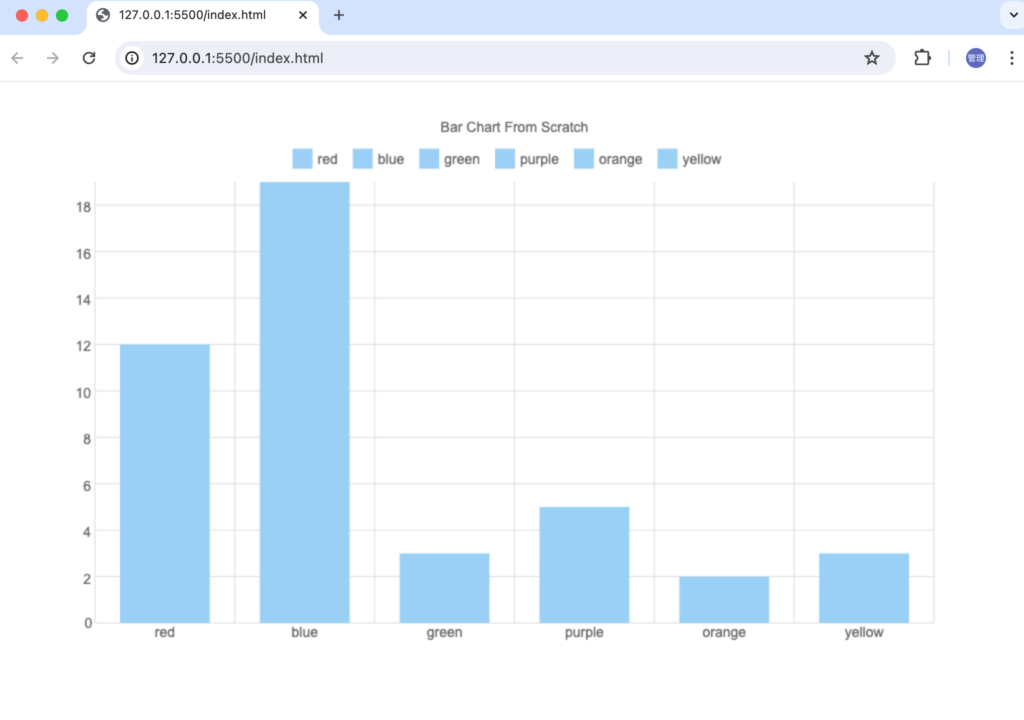
Bar Chartのタイトルの描写
Bar Chartのタイトルを設定するためにBarChart ClassにtitleプロパティとdrawTitleメソッドを追加します。
class BarChart {
  constructor(
    data,
    labels,
    padding = 100,
    gap = 25,
    tick = 2,
    title = 'Bar Chart From Scratch'
  ) {
    this.data = data;
    this.labels = labels;
    this.padding = padding;
    this.gap = gap;
    this.tick = tick;
    this.title = title;
    this.dataWidth = 0;
    this.barWidth = 0;
    this.barHeight = 0;
  }
  //略
  drawTitle() {
     const x = window.innerWidth / 2 - ctx.measureText(this.title).width / 2;
     drawText(this.title, x, this.padding / 2);
   }
//略
追加したdrawTitle関数を実行します。
const barChart = new BarChart(data, labels);

barChart.init();
barChart.drawXAxis();
barChart.drawYAxis();
barChart.drawLabels();
barChart.drawLegend();
barChart.drawTitle();
barChart.drawBars();

window.addEventListener('resize', () => {
  canvas.width = window.innerWidth;
  canvas.height = window.innerHeight;
  barChart.init();
  barChart.drawXAxis();
  barChart.drawYAxis();
  barChart.drawLabels();
  barChart.drawLegend();
    barChart.drawTitle();
  barChart.drawBars();
});
ブラウザで確認するとLegendの上部に設定したタイトルが表示されます。
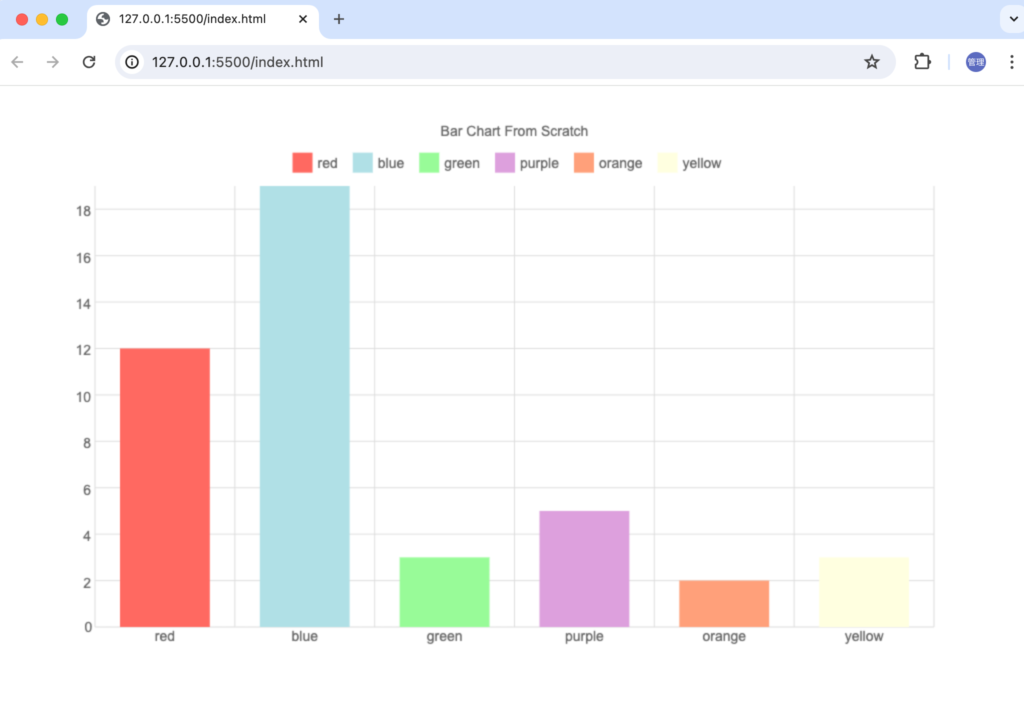
Bar毎に個別のカラーを設定
ここまでの設定ではBarに同じカラーが設定されていましたが個別のカラーを設定することもできます。colors変数を定義して色を設定します。
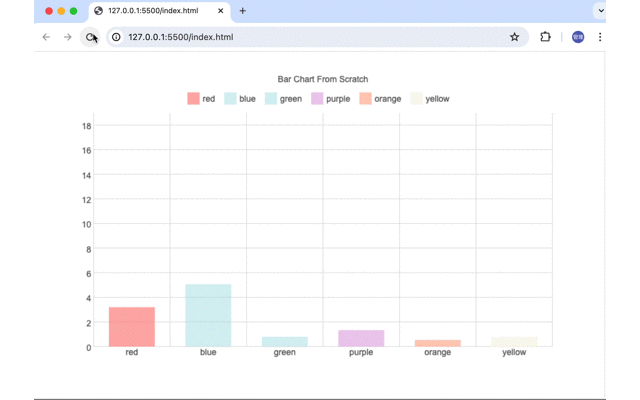
const data = [12, 19, 3, 5, 2, 3];
const labels = ['red', 'blue', 'green', 'purple', 'orange', 'yellow'];
const colors = [
  'rgb(255 105 97)',
  'rgb(176 224 230)',
  'rgb(176 224 230)',
  'rgb(221 160 221)',
  'rgb(255 160 122)',
  'rgb(255 255 224)',
];
drawRect関数の引数から色を指定できるように変更します。
const drawRect = (x, y, width, height, color = 'rgb(154,208,245)') => {
  ctx.beginPath();
  ctx.rect(x, y, width, height);
  // ctx.stroke();
  ctx.fillStyle = color;
  ctx.fill();
};
drawBars関数とdrawLegend関数の中で実行しているdrawRect関数の引数に色の情報(colors[index])を追加します。
drawBars() {
  this.data.forEach((value, index) => {
    const x = this.padding + index * this.dataWidth;
    const y = canvas.height - value * this.barHeight - this.padding;
    drawRect(
      this.gap + x,
      y,
      this.barWidth,
      value * this.barHeight,
      colors[index]
    );
  });
}
//略
drawLegend() {
  let legendLength = 0;
  this.labels.forEach((label) => {
    legendLength += ctx.measureText(label).width + 40;
  });
  let x = canvas.width / 2 - legendLength / 2;
  const y = (this.padding * 2) / 3;
  this.labels.forEach((label, index) => {
    drawRect(x, y, 20, 20, colors[index]);
    const textWidth = ctx.measureText(label).width;
    drawText(label, x + 25, y + 15);
    x += textWidth + 40;
  });
}
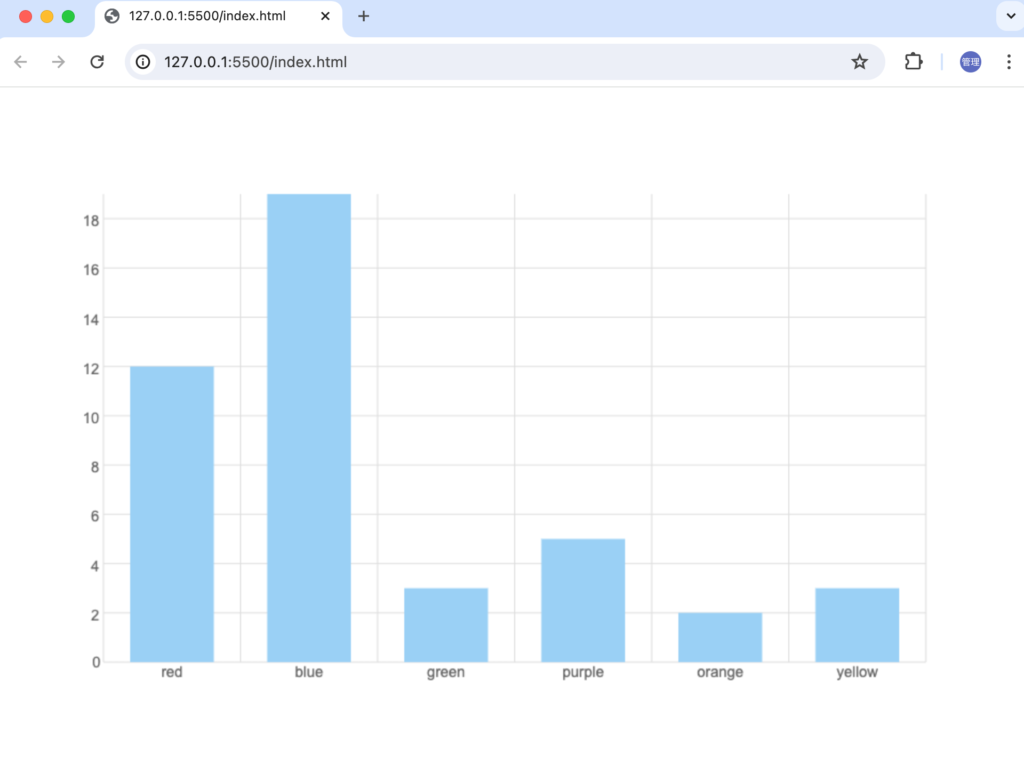
ブラウザで確認すると指定した色でBarが描写されていることが確認できます。
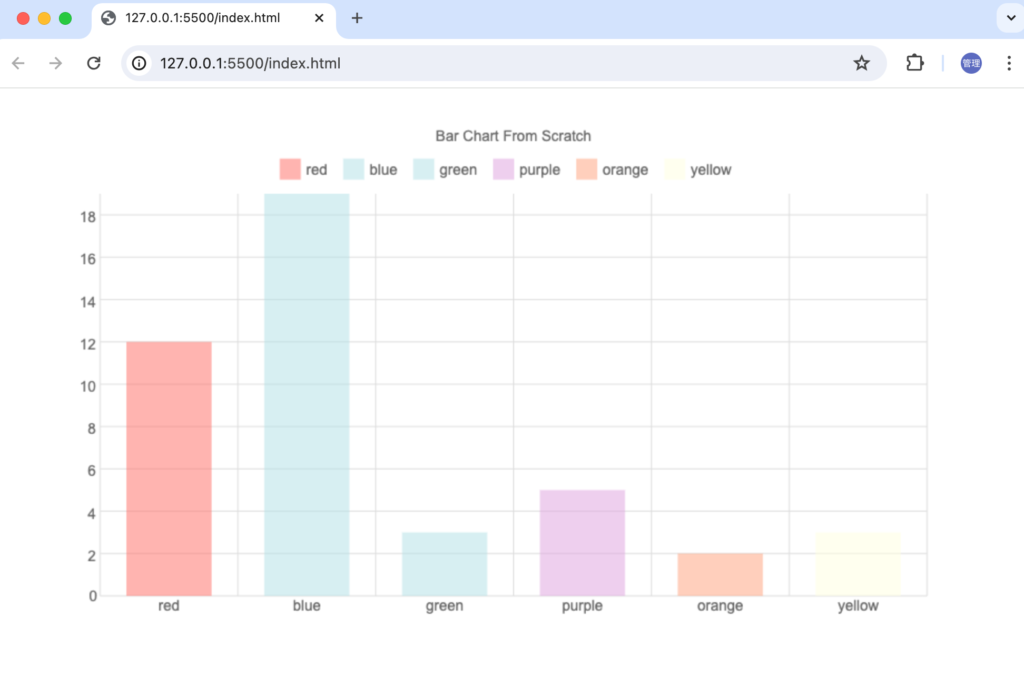
色を半透明にしたい場合には下記のように%を設定することで実現できます。
const colors = [
  'rgb(255 105 97 / 50%)',
  'rgb(176 224 230 / 50%)',
  'rgb(176 224 230 / 50%)',
  'rgb(221 160 221 / 50%)',
  'rgb(255 160 122 / 50%)',
  'rgb(255 255 224 / 50%)',
];
ブラウザで確認すると半透明になっていることが確認できます。
Bar Chartにアニメーションを設定
ページを開くとゆっくりとBar Chartが伸びていくようにアニメーションの設定を行います。
animateDrawBars関数をBarChart Classに追加します。
requestAnimationFrameを利用してすべてBarがデータの高さまでに伸びるまでdraw関数を繰り返し実行させています。requestAnimationFrameでdraw関数を実行する度にcanvasをctx.clearRectでクリアしてdrawXAxisメソッドなどを実行して再描写を行っています。
animateDrawBars() {
  const currentHeight = [];
  const reachedHeight = [];
  this.data.forEach((value, index) => {
    currentHeight.push(0);
    reachedHeight.push(false);
  });

  const draw = () => {
    ctx.clearRect(0, 0, canvas.width, canvas.height);
    this.drawXAxis();
    this.drawYAxis();
    this.drawLabels();
    this.drawTitle();
    this.drawLegend();

    this.data.forEach((value, index) => {
      const x = this.padding + index * this.dataWidth;
      const y = canvas.height - this.padding;
      const increment = value / 15;
      currentHeight[index] += increment;
      if (currentHeight[index] > value) {
        currentHeight[index] = value;
        reachedHeight[index] = true;
      }

      drawRect(
        x + this.gap,
        y,
        this.barWidth,
        -currentHeight[index] * this.barHeight,
        colors[index]
      );
    });

    if (!reachedHeight.every((val) => val === true)) {
      requestAnimationFrame(draw);
    }
  };
  draw();
}
実行する関数をdrawBars関数から追加したanimateDrawBars関数に変更します。
const barChart = new BarChart(data, labels);

barChart.init();
barChart.drawXAxis();
barChart.drawYAxis();
barChart.drawLabels();
barChart.drawLegend();
barChart.drawTitle();
barChart.animateDrawBars();

window.addEventListener('resize', () => {
  canvas.width = window.innerWidth;
  canvas.height = window.innerHeight;
  barChart.init();
  barChart.drawXAxis();
  barChart.drawYAxis();
  barChart.drawLabels();
  barChart.drawLegend();
  barChart.drawTitle();
  barChart.animateDrawBars();
});
ページを開いた直後、ブラウザのサイズを変更した場合にアニメーションが実行されBarChartのBarがアニメーションで指定の高さまで伸びていきます。
説明は長くなりましたがCanvasでBar Chartを作成するのもそれほど難しいものではないことがわかってもらえたのでしょうか。実際に本番環境でスクラッチから作成したチャートを利用するという機会は少ないとは思いますがBar Chart以外のChartを学習として作成すればプログラミングのレベルも向上すると思うので興味のある人はぜひチャレンジしてみてください。
最終的に作成したコードは下記の通りです。
<!DOCTYPE html>
<html>
  <head>
    <meta charset="UTF-8" />
    <meta name="viewport" content="width=device-width, initial-scale=1.0" />
  </head>
  <body>
    <canvas id="canvas"></canvas>
  </body>
  <script>
    const canvas = document.getElementById('canvas');
    const ctx = canvas.getContext('2d');
    canvas.width = window.innerWidth;
    canvas.height = window.innerHeight;

    const drawRect = (
      x,
      y,
      width,
      height,
      color = 'rgb(154,208,245 / 50%)'
    ) => {
      ctx.beginPath();
      ctx.rect(x, y, width, height);
      // ctx.stroke();
      ctx.fillStyle = color;
      ctx.fill();
    };

    const drawLine = (x1, y1, x2, y2, color = '#ddd') => {
      ctx.beginPath();
      ctx.moveTo(x1, y1);
      ctx.lineTo(x2, y2);
      ctx.strokeStyle = color;
      ctx.stroke();
    };

    const drawText = (text, x, y) => {
      ctx.beginPath();
      ctx.fillStyle = '#666';
      ctx.font = '14px Arial';
      ctx.fillText(text, x, y);
    };

    const data = [12, 19, 3, 5, 2, 3];
    const labels = ['red', 'blue', 'green', 'purple', 'orange', 'yellow'];
    const colors = [
      'rgb(255 105 97 / 50%)',
      'rgb(176 224 230 / 50%)',
      'rgb(176 224 230 / 50%)',
      'rgb(221 160 221 / 50%)',
      'rgb(255 160 122 / 50%)',
      'rgb(255 255 224 / 50%)',
    ];
    class BarChart {
      constructor(
        data,
        labels,
        padding = 100,
        gap = 25,
        tick = 2,
        title = 'Bar Chart From Scratch'
      ) {
        this.data = data;
        this.labels = labels;
        this.padding = padding;
        this.gap = gap;
        this.tick = tick;
        this.title = title;
        this.dataWidth = 0;
        this.barWidth = 0;
        this.barHeight = 0;
      }

      init() {
        this.dataWidth = (canvas.width - this.padding * 2) / data.length;
        this.barWidth = this.dataWidth - this.gap * 2;
        this.barHeight = (canvas.height - this.padding * 2) / Math.max(...data);
      }

      drawBars() {
        this.data.forEach((value, index) => {
          const x = this.padding + index * this.dataWidth;
          const y = canvas.height - value * this.barHeight - this.padding;
          drawRect(
            this.gap + x,
            y,
            this.barWidth,
            value * this.barHeight,
            colors[index]
          );
        });
      }

      animateDrawBars() {
        const currentHeight = [];
        const reachedHeight = [];
        this.data.forEach((value, index) => {
          currentHeight.push(0);
          reachedHeight.push(false);
        });

        const draw = () => {
          ctx.clearRect(0, 0, canvas.width, canvas.height);
          this.drawXAxis();
          this.drawYAxis();
          this.drawLabels();
          this.drawTitle();
          this.drawLegend();

          this.data.forEach((value, index) => {
            const x = this.padding + index * this.dataWidth;
            const y = canvas.height - this.padding;
            const increment = value / 15;
            currentHeight[index] += increment;
            if (currentHeight[index] > value) {
              currentHeight[index] = value;
              reachedHeight[index] = true;
            }

            drawRect(
              x + this.gap,
              y,
              this.barWidth,
              -currentHeight[index] * this.barHeight,
              colors[index]
            );
          });

          if (!reachedHeight.every((val) => val === true)) {
            requestAnimationFrame(draw);
          }
        };
        draw();
      }

      drawXAxis() {
        let index = 0;
        let y = canvas.height - this.padding;
        while (y >= this.padding) {
          drawLine(this.padding, y, canvas.width - this.padding, y);
          const labelWidth = ctx.measureText(index * this.tick).width;
          const labelHeight = parseInt(ctx.font);
          drawText(
            index * this.tick,
            this.padding - labelWidth - 4,
            y + labelHeight / 2
          );
          y -= this.barHeight * this.tick;
          index++;
        }
      }

      drawYAxis() {
        let x = 0;
        this.data.forEach((value, index) => {
          x = index * this.dataWidth + this.padding;
          drawLine(x, canvas.height - this.padding, x, this.padding);
        });
        x = data.length * this.dataWidth + this.padding;
        drawLine(x, canvas.height - this.padding, x, this.padding);
      }

      drawLabels() {
        this.labels.forEach((label, index) => {
          const x = index * this.dataWidth + this.padding;
          const labelWidth = ctx.measureText(label).width;
          const labelHeight = parseInt(ctx.font);
          drawText(
            this.labels[index],
            x + this.dataWidth / 2 - labelWidth / 2,
            canvas.height - this.padding + labelHeight
          );
        });
      }

      drawLegend() {
        let legendLength = 0;
        this.labels.forEach((label) => {
          legendLength += ctx.measureText(label).width + 40;
        });
        let x = canvas.width / 2 - legendLength / 2;
        const y = (this.padding * 2) / 3;
        this.labels.forEach((label, index) => {
          drawRect(x, y, 20, 20, colors[index]);
          const textWidth = ctx.measureText(label).width;
          drawText(label, x + 25, y + 15);
          x += textWidth + 40;
        });
      }

      drawTitle() {
        const x = window.innerWidth / 2 - ctx.measureText(this.title).width / 2;
        drawText(this.title, x, this.padding / 2);
      }
    }

    const barChart = new BarChart(data, labels);

    barChart.init();
    barChart.drawXAxis();
    barChart.drawYAxis();
    barChart.drawLabels();
    barChart.drawLegend();
    barChart.drawTitle();
    barChart.animateDrawBars();

    window.addEventListener('resize', () => {
      canvas.width = window.innerWidth;
      canvas.height = window.innerHeight;
      barChart.init();
      barChart.drawXAxis();
      barChart.drawYAxis();
      barChart.drawLabels();
      barChart.drawLegend();
      barChart.drawTitle();
      barChart.animateDrawBars();
    });
  </script>
</html>